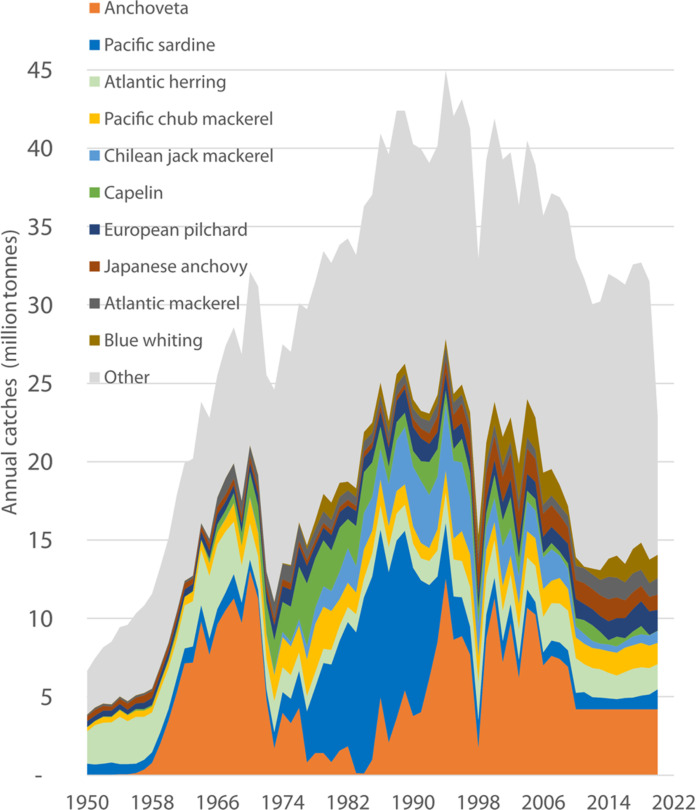
Fig. 1. Cumulative landings of reduction fisheries 1950–2020.
The graph shows the disproportionate effect of the Peruvian anchoveta fishery (bottom orange) on the shape of the curve. FAO/FISHSTAT (100) (www.fao.org/fishery/static/Data/Capture_2023.1.1.zip).

