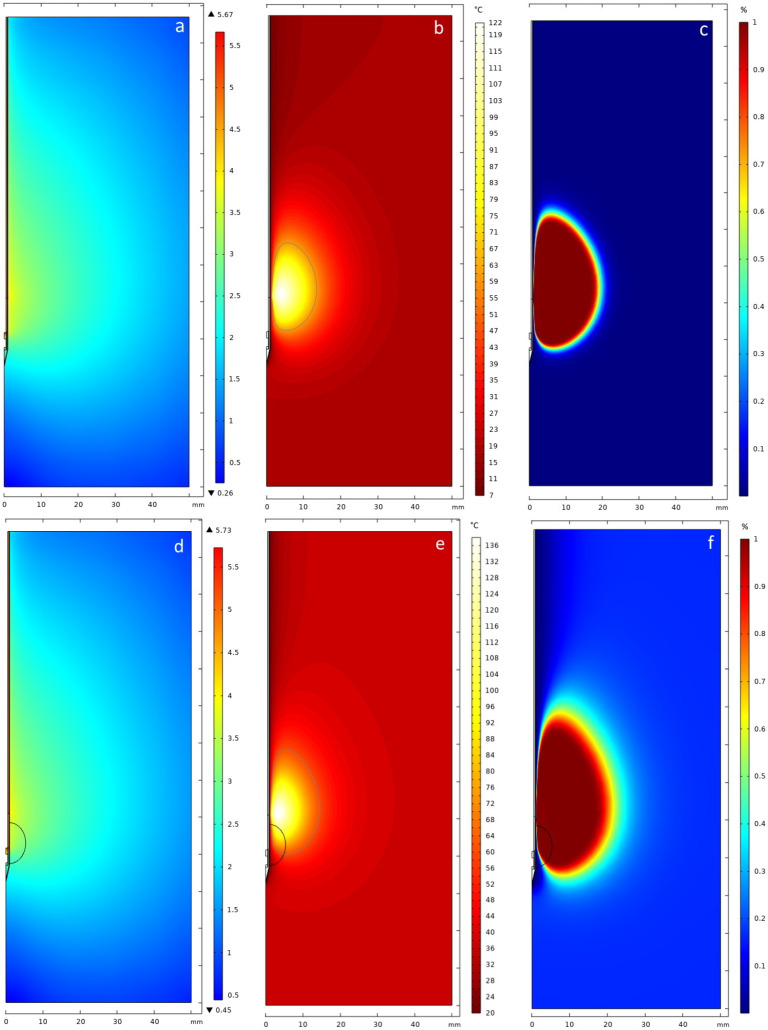
Figure 9.
Qualitative evaluation of the simulation results after 10 min, where (a–c) represents the phantom and (d–f) the clinical case (the black contour represents the tumor). (a,d) The electrical field was calculated with an input power of 35 W for the phantom and 42 W for the clinical case, respectively. The electric al field in COMSOL is displayed using a logarithmic scale; (b,e) 2D temperature field. The gray line marks a 60 °C isoline; (c,f) 2D Arrhenius kinetics provides the degree of tissue injury from 0 to 100% (the threshold used was 98%).

