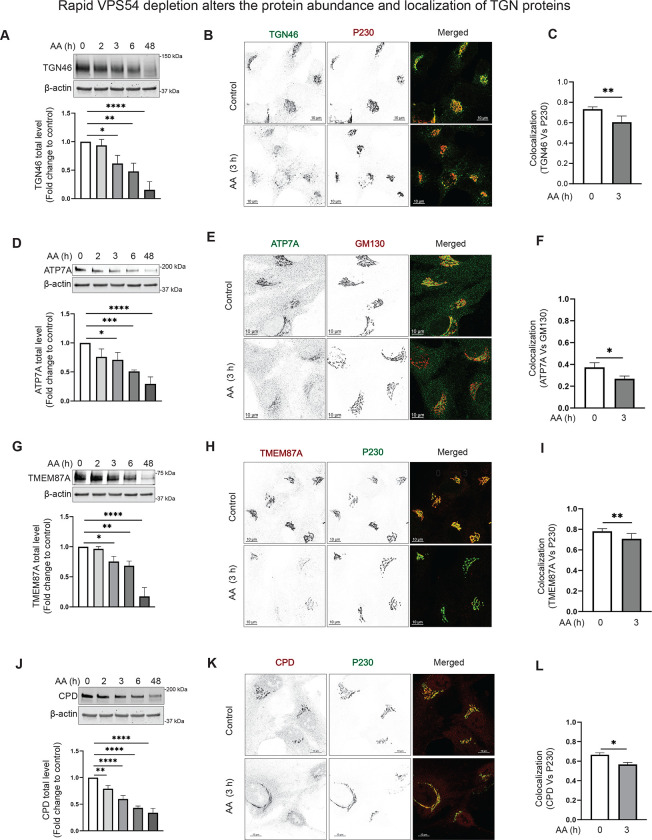
Figure 3: Acute depletion of VPS54 alters the abundance and localization of TGN proteins.
(A), (D), (G), and (J) RPE1 cells expressing VPS54-mAID were treated with AA for 0, 2, 3, 6, and 48 h respectively to deplete VPS54. (Top panels) WB analysis of cell lysates was performed and probed with (A) anti-TGN46, (D) anti-ATP7A, (G) anti-TMEM87A, and (J) anti-CPD antibody. (Bottom panels) Quantification of the blots from three independent experiments. (B), (E), (H), (K) RPE1 cells expressing VPS54-mAID were treated with AA for 3 h and co-stained for (B) TGN46 and P230, (E) ATP7A and GM130, (H) TMEM87A and P230, (K) CPD and P230. (C), (F), (I), and (L) Colocalization analysis was performed by calculating the Pearson’s correlation coefficient for (C) TGN46 and P230, (F) ATP7A and GM130, (I) TMEM87A and P230, and (L) CPD and P230. At least 50 cells were imaged per sample for the quantification. Statistical significance was assessed using one-way ANOVA. ** p≤ 0.01, * p ≤ 0.05.

