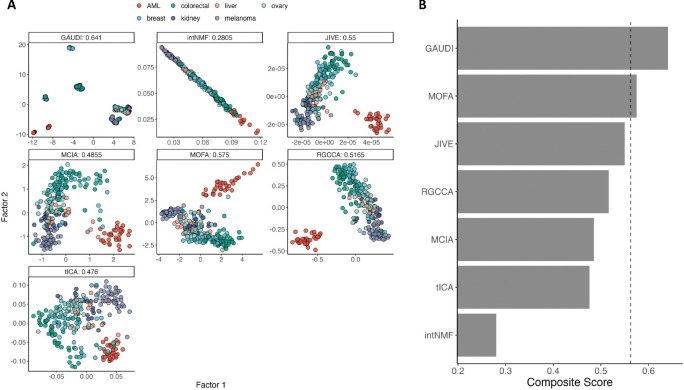
Figure 4: Lineage Discrimination Analysis in DepMap Multi-Omics Data.
A. Scatterplots of the two factors derived from multi-omics integration across each method. The plots are annotated with composite scores, calculated as the average of Adjusted Rand Index (ARI) and cluster purity, which collectively assess the accuracy and homogeneity of the lineage-specific clustering. A higher composite score indicates superior performance in accurately classifying cell lineages based on the integrated multi-omics data. The cells are color-coded by its lineage. B. Composite scores are presented across the methods, with the vertical dashed line indicating the third quantile (75%).

