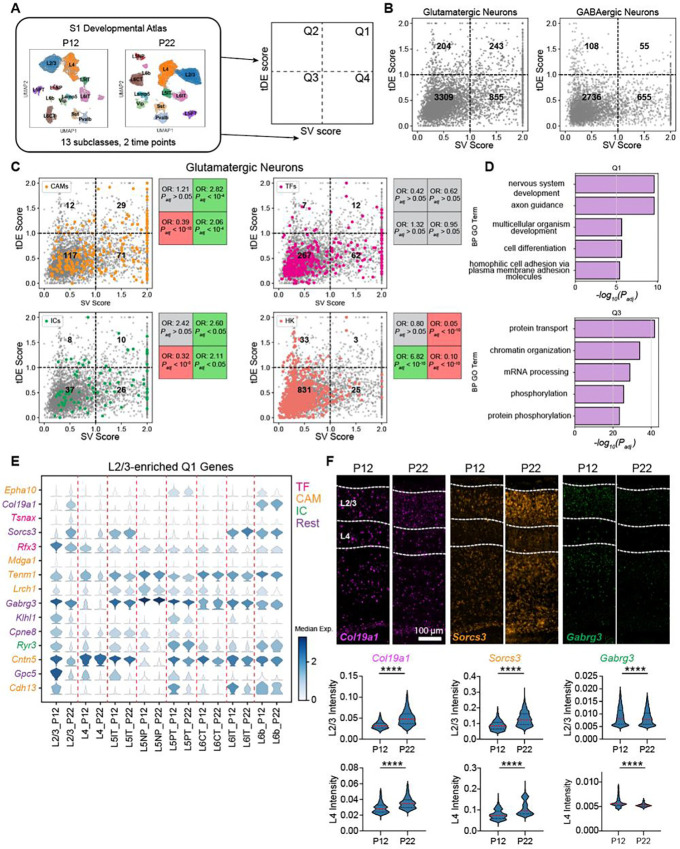
Figure 2. Gene expression changes between P12 and P22 are enriched in neurodevelopmental processes.
(A) Overview of analyses to classify genes based on subclass variability and temporal differential expression. (B) Scatter plot of subclass variability (SV) scores and temporal differential expression (tDE) scores of genes in glutamatergic (left) and GABAergic neurons (right). Scores along each axis are capped at the value of 2. (C) Same as B for glutamatergic neurons with four gene categories highlighted. Subpanels (clockwise, starting from top left) correspond to cell adhesion molecules (CAMs), transcription factors (TFs), housekeeping genes (HKs), and ion channels (ICs). Boxes on the right of each panel list the odds ratio (OR) and adjusted p-value (Padj) for the enrichment of the corresponding gene category in each quadrant (Fisher’s exact test). Grey values indicate neither enrichment nor depletion, while red and green indicate depletion and enrichment, respectively (see Methods for details). (D) Q1 is enriched in gene ontology (GO) programs associated with neurodevelopment, while Q3 is enriched in general housekeeping processes. (E) Stacked violin plot of example genes (rows) from Q1 with the highest tDE score in L2/3. Columns correspond to subclasses at P12 and P22, violins represent the expression distribution, and color represents median expression. Genes are colored according to the functional categories as in panel C. (F) FISH for tDE genes. Representative images (top) from an ‘across-row’ (see Methods) section in wS1. Cortical layers 2/3 and 4 are indicated on the sections. Quantification (bottom) of mean intensity in nuclei revealed strong temporal regulation of gene expression in L2/3 consistent with what was measured with snRNA-seq (see Fig 2E). Mann-Whitney test, ****p< 0.0001. L2/3_Col19a1: n = 4133, 3268 nuclei, L4_Col19a1: n = 1904, 1665 nuclei, L2/3_Sorcs3: n = 4414, 3394, L4_Sorcs3: n = 2221, 1876, L2/3_Gabrg3: n = 4340, 3210, L4_Gabrg3: n = 1808, 1564. Three mice per condition, two slices per mouse.

