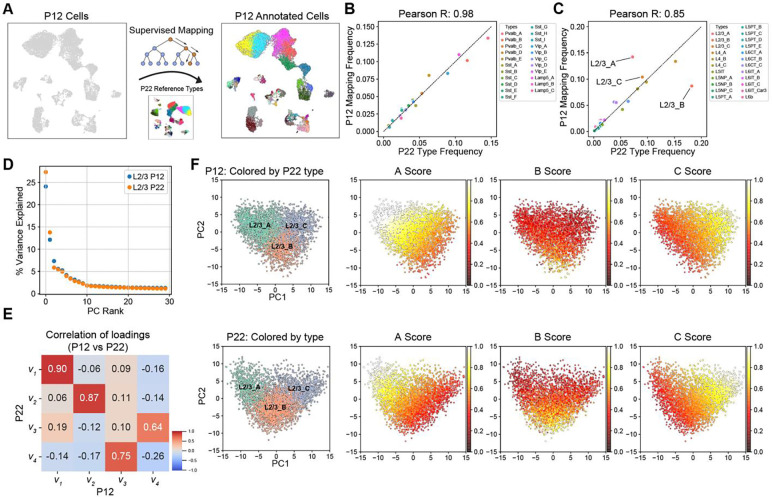
Figure 3. L2/3 pyramidal cell type composition is selectively regulated during development.
(A) Schematic for transferring P22 cell type labels (reference data) to P12 cells to facilitate cell type-level comparisons. (B) Within GABAergic neurons (~20% of all neurons), all cell types have approximately the same relative frequency between P12 (y-axis) and P22 (x-axis). Pearson correlation coefficient between the relative frequencies is indicated on top. (C) Same as panel B, for glutamatergic neurons (~80% of all neurons). All glutamatergic cell types except for L2/3_A and L2/3_B have approximately the same relative frequency between P12 and P22. (D) Percent variance captured (y-axis) by each principal component (PC) within L2/3 neurons at P12 and P22 (colors). Note that PCA is performed independently on each dataset. For both ages, a spectral gap is observed after PC1 and PC2. (E) Pair-wise Pearson R values between the first four principal eigenvectors between P12 and P22. The first two principal eigenvectors corresponding to PC1 and PC2, which dominate the variance, map 1:1 between both ages with a high correlation. (F) Scatter plot of PC1 vs PC2 for L2/3 neurons at P12 (top row) and P22 (bottom row). With each row, the leftmost panel highlights cells by their type-identity (L2/3_A, L2/3_B, and L2/3_C). In the remaining panels within each row, cells are colored based on their aggregate expression levels of markers for each type (see Methods). Between P12 and P22, L2/3_A markers decrease in expression and increase in specificity, while L2/3_B markers increase in expression during development, driving cell type identity maturation.

