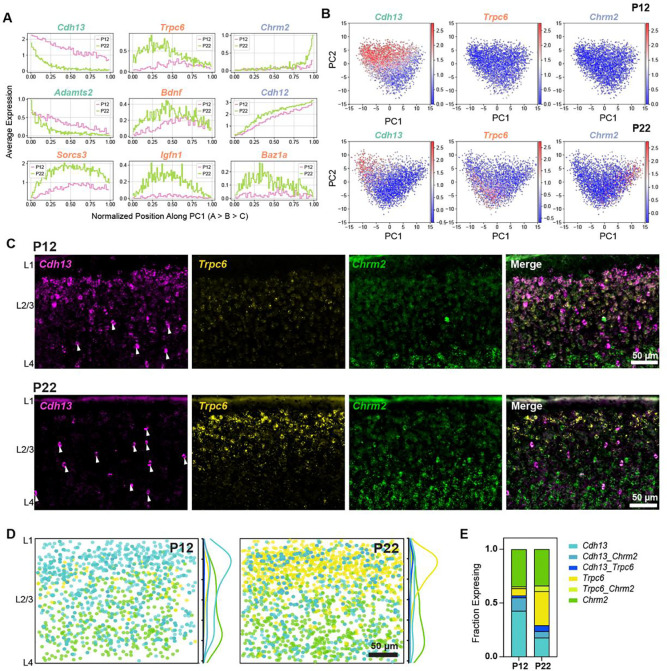
Figure 4. Cell type-specific temporal gene expression changes in L2/3 glutamatergic neurons.
(A) Expression patterns of some L2/3 cell type-enriched genes along PC1 from Fig 3F. Genes are colored based on their type enrichment: A, green; B, orange; C, purple. Other genes are shown in Fig S4. (B) Same as Fig 3F, with cells colored by expression levels of Cdh13 (left), Trpc6 (middle), and Chrm2 (right), which are targeted for FISH experiments in panels C-E. (C) Representative FISH images showing labeling of cell type markers Cdh13, Trpc6, and Chrm2 at P12 and P22 within wS1 L2/3. Arrowheads indicate putative Cdh13-expressing interneurons (See Fig S5A). (D) Summary plots based on overlay of all images of L2/3 visualizing expression of Cdh13, Trpc6, and Chrm2 at P12 and P22. Circles represent individual excitatory cells within L2/3, colored based on their expression of one or more marker genes (color code as in panel E). To the right of each summary plot is the kernel density estimate for each type along the pial-ventricular axis. Cdh13+ cells dominate in upper L2/3 at P12, whereas Trpc6+ cells are more abundant at P22. N = 10–12 slices from 3 mice per time point. (E) Quantification of the fraction of excitatory (Slc17a7+, not shown) L2/3 cells expressing one or more markers Cdh13, Trpc6, and Chrm2 at P12 and P22. N = 10–12 slices from 3 mice per time point.

