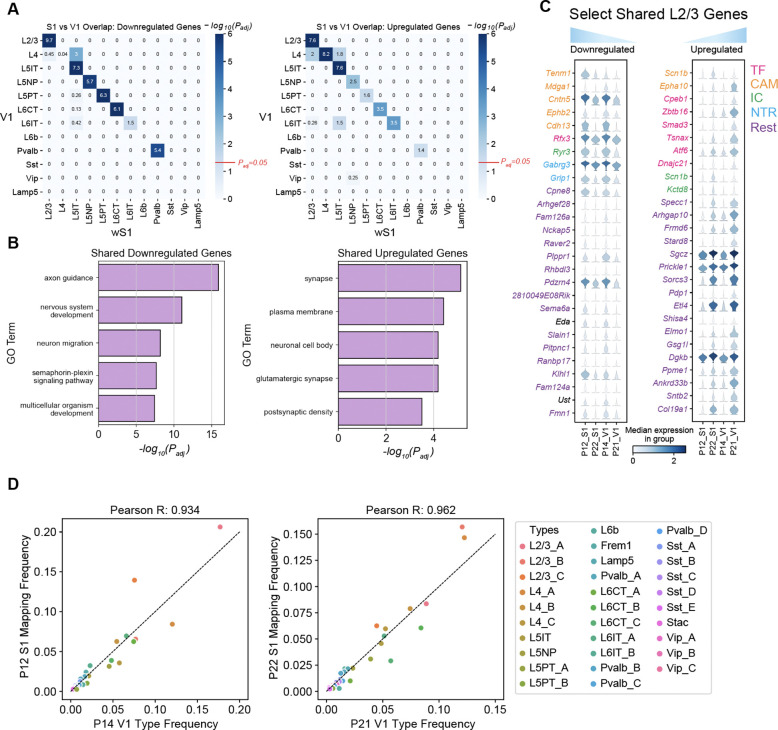
Figure 5. Comparative transcriptomic analysis of wS1 and V1.
(A) Heatmap highlighting the overlap of tDE genes between all pairs of wS1 subclasses (P12 vs. P22; rows) and V1 subclasses (P14 vs. P21; columns). The left and right panels correspond to downregulated and upregulated genes. Values correspond to Bonferroni-corrected −log10(Padj) values from a hypergeometric test of overlap of tDE genes. The background set for these tests was the set of all the genes regulated in any subclass. Except for L4, subclasses with fewer than 10 tDE genes (Figs S2C, S6A) showed little to no overlap. The value Padj = 0.05 is highlighted on the scalebar (right). (B) Top 5 GO terms from shared downregulated and upregulated genes in V1 and wS1 in corresponding subclasses from panel A. See Fig S6C for a full list. (C) Examples of shared genes that are temporally downregulated (left) and upregulated (right) in L2/3 neurons between V1 and wS1. (D) Scatter plots showing highly similar relative frequencies between matched cell types (see Fig S6D) across V1 and wS1.

