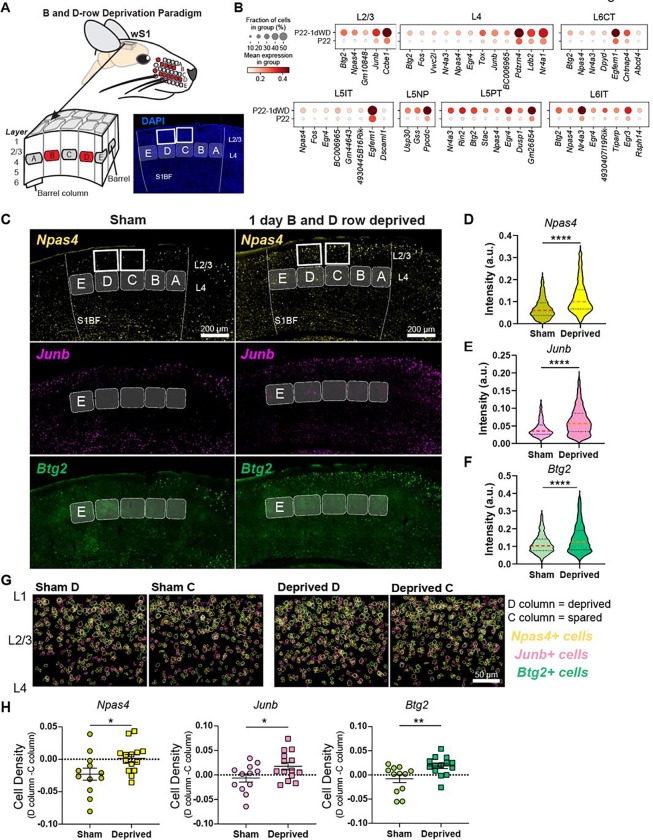
Figure 7. Brief row whisker deprivation (1d RWD) upregulates activity-dependent gene expression programs in deprived columns.
(A) Schematic representation of the 1d row-whisker deprivation (RWD) manipulation and ‘across-row’ S1 section in which all barrel columns are identifiable. A representative image of DAPI labeling in ‘across-row’ S1 section. (B) Dotplots of genes upregulated by 1d RWD in glutamatergic subclasses (panels). Within each panel, rows indicate condition and columns indicate genes. The size of each circle corresponds to the % of cells with nonzero expression, and the color indicates average expression level. (C) Representative widefield images of wS1. Barrels and barrel fields are indicated with light grey rectangles and labeled. Boxes indicate the locations of ROIs used for analysis in G. (D) Npas4 intensity inside Slc17a7+ L2/3 excitatory cells is increased after 1d RWD. Violin plots show median (dashed line) and quartiles (dotted lines). Mann-Whitney test, p < 0.0001 ****, n = 1571, 1337 cells respectively, from 3–4 mice per group. (E) Junb intensity inside Slc17a7+ L2/3 cells is increased after 1d RWD. Mann-Whitney test, p < 0.0001 ****, n = 1483, 1405 cells respectively, from 3–4 mice per group. (F) Btg2 intensity inside Slc17a7mice per group+ L2/3 cells is increased after 1d RWD. Mann-Whitney test, p < 0.0001 ****, n = 1561, 1369 cells respectively, from 3–4 per group. (G) L2/3 C and D columns were compared to examine whether effects are specific to the deprived (D) column. Pseudocolored outlines of Npas4, Junb, and Btg2 expressing cells. Each plot is an overlay of 5 images of L2/3 S1 from 3 mice. (H) Quantification of column-specific changes in 1d RWD upregulated genes measuring. Plotted values are the difference between the fraction of Npas4/Junb/Btg2 expressing cells among all excitatory (Slc17a7+) cells in the L2/3 D column and the corresponding fraction in the L2/3 C column. Symbols represent slices from sham and 1d RWD mice. For each condition, mean and SEM (error bars) are shown. Npas4: Unpaired t-test, *p = 0.0321, n = 12,14 slices, 3–4 mice. JunB: Unpaired t-test, *p = 0.0427, n = 12,14 slices, 3–4 mice. Btg2: Mann-Whitney, **p = 0.0077, n = 12,14 slices, 3–4 mice.

