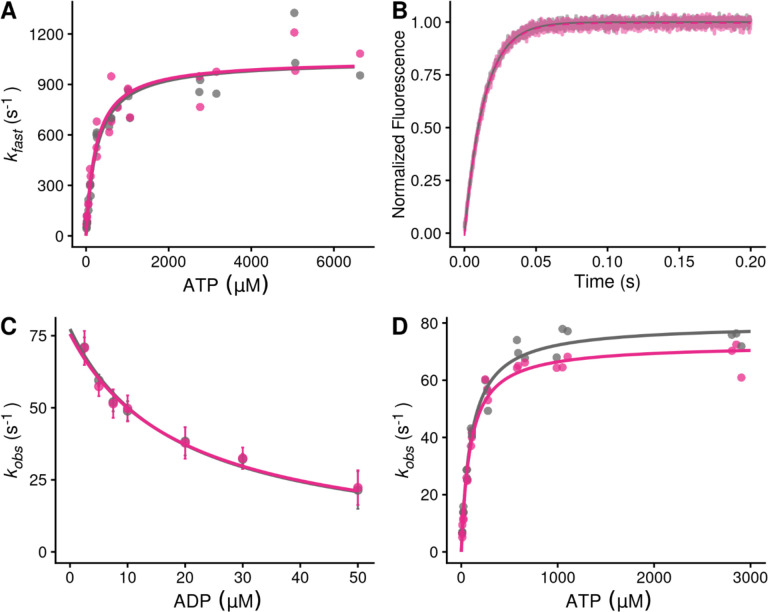
Figure 2. Stopped-flow kinetics measured with and without 10 μM danicamtiv.
Black = DMSO control. Pink = 10 μM danicamtiv. A) The rates of ATP-induced actomyosin dissociation were measured in the stopped flow. Transients were well fitted by the sum of two exponential functions, where the observed rate of the fast phase (kfast) is plotted as a function of ATP concentration. Data were fitted with a hyperbolic function to obtain K1’ and k+2’. There are no differences in either K1’ or k+2’ with or without danicamtiv (P = 0.64 and P = 0.99, respectively). Each point represents an independent measurement over 3 experimental days. B) The rate of ADP release from actomyosin was measured using stopped flow techniques, and the fluorescence transients were fitted with single exponential functions. Note, both 0 and 10 μM danicamtiv are plotted and overlay. There is no statistically significant difference in the rate of ADP release the absence or presence of danicamtiv (P = 0.96). C) The overall ADP binding affinity to actomyosin was measured by mixing an actomyosin solution containing increasing concentrations of ADP with 50 μM ATP (concentrations after mixing) measured using a competition experiment. The observed rate as a function of ADP concentration was fitted with a hyperbolic function to determine the ADP affinity (see methods). Each point shows the average of 3 separate trials and error bars show the standard deviations. There is no difference in the ADP binding affinity (k-5’; P = 0.40). D) The rate of ATP hydrolysis by myosin was measured using stopped flow techniques. The rate of hydrolysis is reported by the change in tryptophan fluorescence at saturating ATP concentrations. Fluorescence transients are well fitted with single exponential functions. The observed rates of ATP hydrolysis were plotted against their respective ATP concentration and fitted with a hyperbolic function. The plateau represents the sum of the forwards and backwards rate of ATP hydrolysis (k3 (obs)). While there was a slight decrease in the observed hydrolysis rate with danicamtiv (P = 0.03), this slight decrease is not biologically meaningful. For all stopped-flow values, see Table 1.

