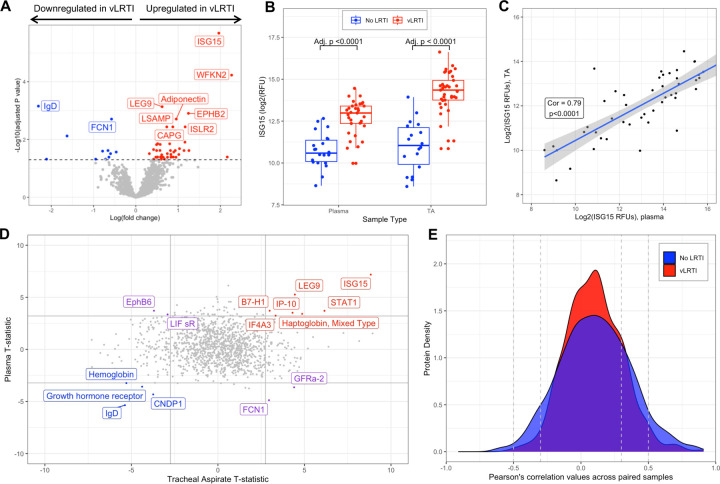
Figure 3: Host protein expression in plasma and comparative proteomic analysis between plasma and tracheal aspirate samples.
A) Volcano plot of the differentially expressed plasma proteins in vLRTI versus No LRTI (age unadjusted). The top ten proteins based based on Padj are labeled. B) Ubiquitin-like ISG-15 protein expression in plasma (left) and tracheal aspirate (TA) (right) in vLRTI (red) and No LRTI (blue) groups. C) Log-log plot showing correlation of ISG-15 values between paired plasma (x-axis) and TA (y-axis) samples. D) T statistics for each protein calculated with limma for vLRTI versus No LRTI comparisons in plasma and TA were plotted against one another. Proteins highlighted in red were significantly upregulated across both body compartments, in blue were downregulated in both, and in purple deviated in opposite directions. E) Density plot showing correlation coefficients for each protein in TA versus plasma, with stratification based on group (vLRTI in red vs No LRTI in blue).

