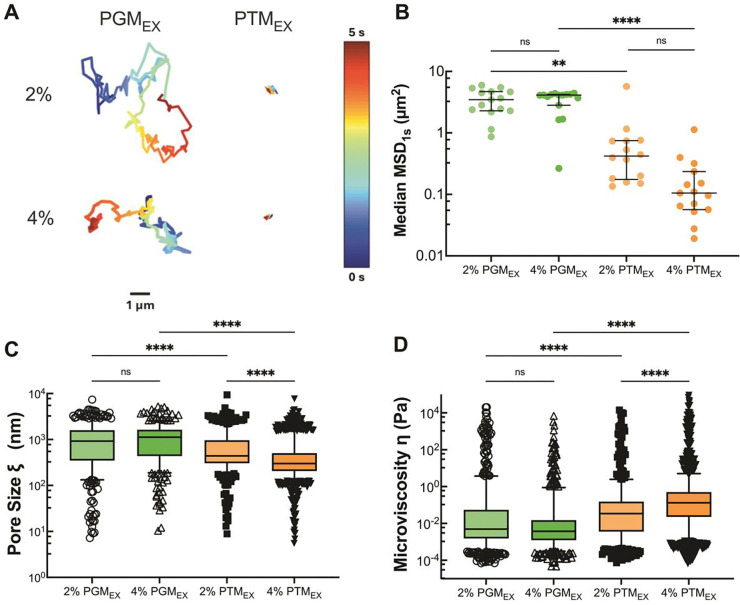
Figure 2. Microrheology of porcine gastric and tracheal mucins.
(A) Representative trajectories of NP diffusion of 100 nm NP in 2% and 4% w/v PTMEX and PGMEX. Trajectory colors change as a function of time with 0 s indicated by dark blue and 5 s indicated by dark red. Scale bar = 1 μm. (B) Calculated median MSD at a time scale of 1 second (MSD1s) for solubilized mucins. Each data point represents the median calculated MSD1s in each video with at least 5 videos from 3 technical replicates. Black lines indicate interquartile range. (C) Estimated pore size (ξ) from NP diffusion. (D) Estimated microviscosity (ƞ) from NP diffusion. Datasets in (B,C,D) analyzed with Kruski-Wallis test with Dunn’s test for multiple comparison: ns = not significant, **** p < 0.0001, ** p < 0.01.

