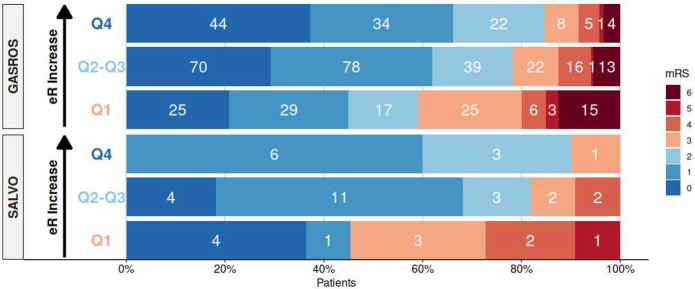
Figure 1.
Quartile distribution of modified Rankin Scale (mRS) in GASROS and SALVO. Good outcome (mRS≤2) in shown shades of blue. Quartiles in each cohort based on eR, calculated using the path coefficients of the structural equation model in GASROS, represent high (Q4), intermediate (Q2–Q3), and low (Q1) brain health. White numbers reflect the number of patients per mRS category, with higher quartiles generally correlating with better outcomes.

