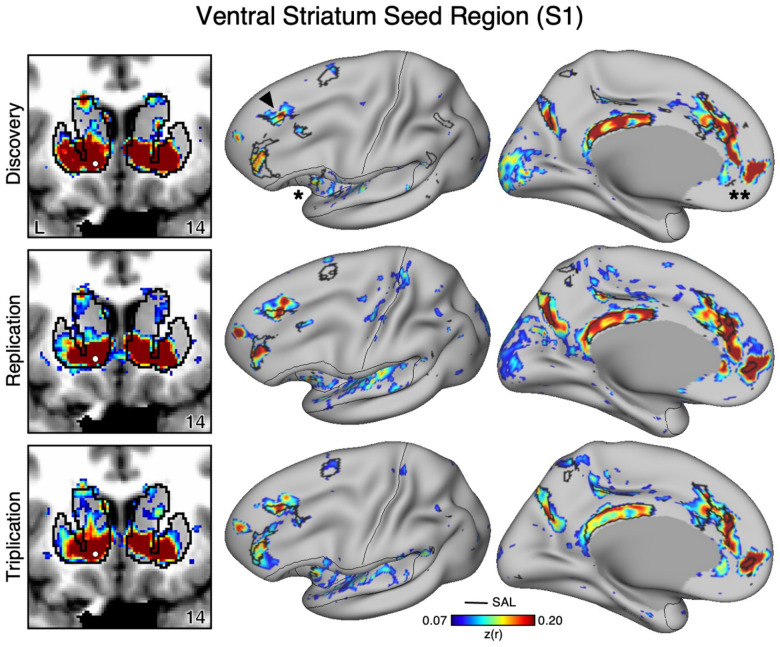
Figure 1. The Ventral Striatum (VS) Correlates with the Full Cortical Extent of the Salience (SAL) Network in S1.
A seed region (indicated with a white circle) in the VS (top left) recapitulates the full extent of the SAL network, including the dorsolateral prefrontal cortex (indicated with a black arrow), insula (indicated by asterisk), anterior cingulate cortex, and rostral portions of the medial prefrontal cortex (indicated by double asterisks). In independent data from S1, this pattern was replicated (second row) and triplicated (third row) using the same seed region (white circles). Cortical results are visualized on the inclated fsaverage6 surface with the lateral view slightly tilted to show the dorsal surface. Striatal results are visualized in coronal sections on each individual’s own T1-weighted anatomical image transformed to the atlas space of the Montreal Neurological Institute (MNI) atlas. L = left. Coordinates in the bottom right of the left panels indicate the y coordinates (in mm). Black outlines in the volume indicate the boundaries of the striatum and outlines on the cortical surface indicate the SAL network (see methods). All correlation values are plotted after r to z conversion using the jet colorscale shown by the legend.

