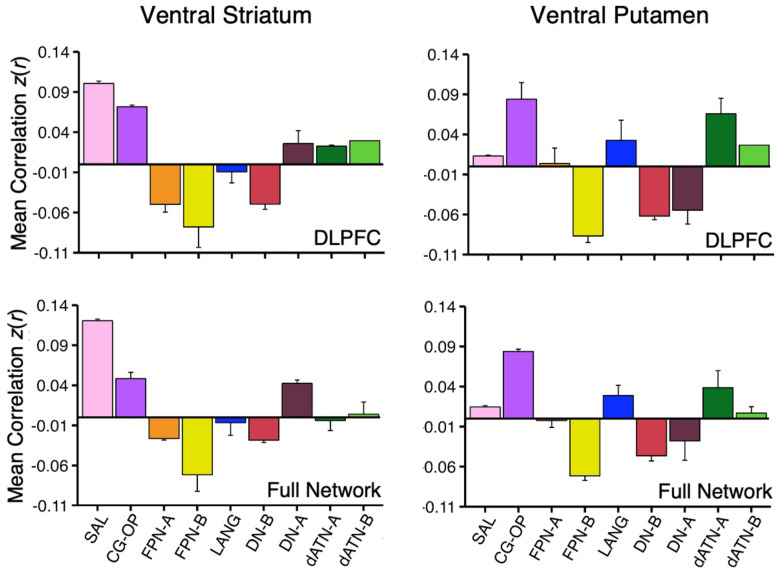
Figure 6. Ventral Striatum (VS) and Ventral Putamen Seed Regions Preferentially Correlate with Distinct Networks.
Mean correlation values are plotted for the DLPFC (Top Panel) and full cortical networks (Bottom Panel) from the two separate striatal seed regions (Left Column, VS; Right Column, Ventral Putamen). The correlation values are the mean values from S1 and S2 extracted from Data Sets 2 and 3 which were independent from the data used to select the seed regions. The VS seed regions are maximally correlated with the SAL network, while the ventral putamen seed regions are maximally correlated with the CG-OP network. The VS seed regions also show strong, positive correlation with the CG-OP network showing the pattern is preferential not selective. Bars show mean correlation (z(r)) in each network, error bars indicate standard error of the mean adjusted for within-subject variance (Cousineau 2005).

