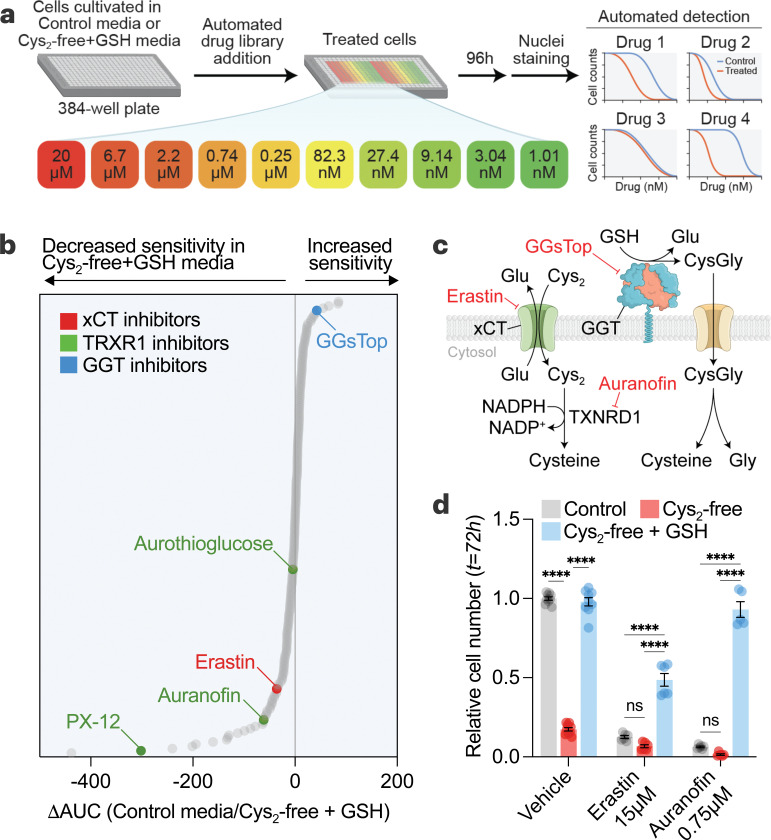
Figure 4. Utilization of GSH as a cysteine source drives drug resistance in cancer cells.
a, Schematic of multifunctional approach to pharmacologic screening (MAPS). HCC1806 cells in control (208 µM cystine) or cysteine-free/GSH-supplemented (500 µM) media were treated with libraries of drugs, each arrayed at 10 dose points (20 µM – 1 nM). After 96 hours, cell numbers were determined, and dose-response curves were generated for each drug. b, MAPS results showing each drug ranked by the difference in the area under the curve (ΔAUC) obtained for each drug curve in the conditions. c, Schematic showing the targets of selected hits from (b). d, HCC1806 cells grown in 6-well plates and treated with erastin and auranofin for 72 hours in different media conditions and relative cell numbers were determined. Statistical significance was evaluated by two-way ANOVA followed by Tukey’s multiple comparisons test (n=3 independent experiments). Data represented as mean ± s.e.m., ***p-value<0.001; ****p-value<0.0001; ns, not significant. Cys2, cystine; CysGly, cysteinylglycine; GGT, γ-glutamyl-transpeptidase; Glu, glutamate; GSH, glutathione; Gly, glycine; NADPH, reduced nicotinamide adenine dinucleotide phosphate; NADP+, oxidized nicotinamide adenine dinucleotide phosphate.

