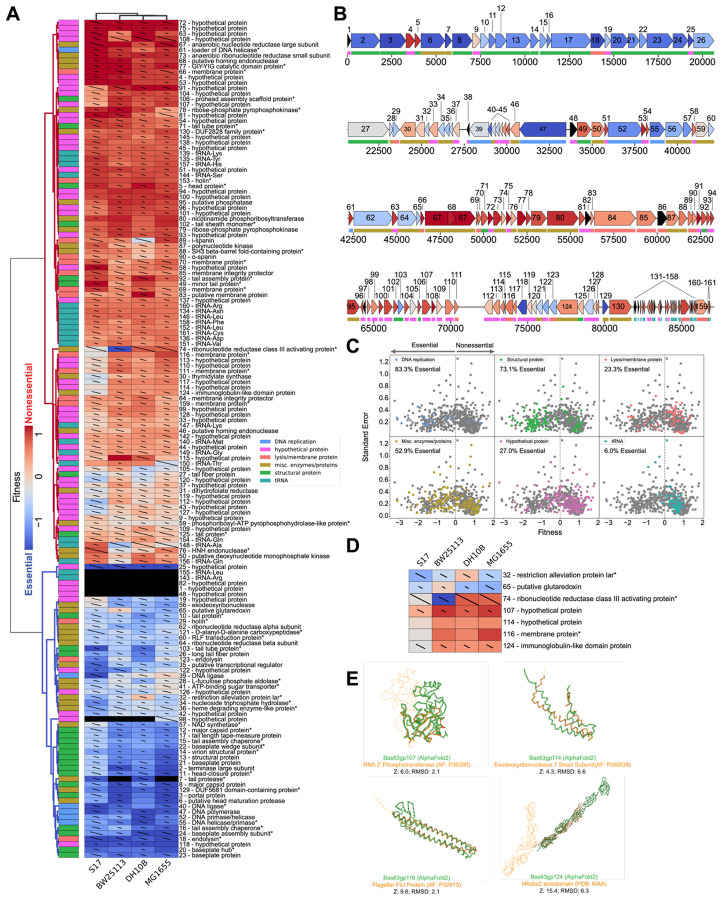
Figure 3. PhageMaP creates gene essentiality profiles for a non-model Bas63 phage.
(A) Heatmap of the Bas63 fitness scores after Z-normalization within each of the 4 conditions. To better emphasize differences outside the two extremes of the data, a 10th percentile floor and a 90th percentile ceiling were imposed for the color scaling. The lines through each cell represent the standard error (SE) where a full line represents SE≥1. Clustering was performed using the Euclidean metric and Ward linkage method. Metadata describes general classification of each gene. Black boxes indicate no data was obtained for the gene in the corresponding condition. A black dot at the top right corner of a cell indicates only one replicate was obtained. Asterisks at the end of gene names indicate genes which were manually annotated after BLASTp search. (B) Bas63 genome architecture colored by the median fitness score for each gene from the tested conditions. Color scaling is the same as (A). (C) Scatter plots showing the fitness scores and standard errors for each fitness measurement for the 11 hosts. Points corresponding to each classification are highlighted by color. Dotted lines represent the threshold for “nonessential” and “essential” genes. (D) Patterns of conditional essentiality from (A). (E) Structural similarities between conditionally essential proteins and proteins found within the AlphaFold database and the PDB.

