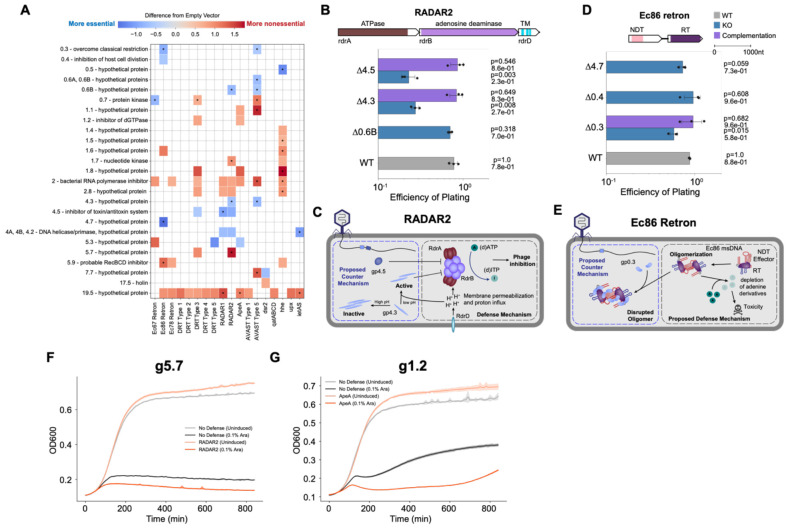
Figure 5. PhageMaP identifies anti-phage defense counters and triggers in T7 phage.
(A) Plot showing all identified uncorrected significant hits (Welch’s t-test, p<0.05) and significant hits after multiple testing correction with the Benjamini-Hochberg method (q<0.1, denoted by an asterisk in each tile) with a score that is at least a difference of 0.5 from the control. The color of the tiles represents the difference in Z-normalized fitness scores between with defense and an Empty Vector control. (B) EOPs for T7 knockouts with the RADAR2 host. Average titers on the control strain were first determined (3 technical replicates). Each point on the plot represents a technical replicate for EOP using those calculated averages as the denominator for each titer measurement on the defense host. Bars represent the mean of three replicates, and error bars denote the standard deviation. Hypothesis testing was performed pairwise with each knockout (KO) and WT. P-values (Welch’s t-test) and means are annotated above the bars. Complementation host contained the defense system and a plasmid expressing deleted gene. (C) Proposed model of defense and counter-defense for RADAR2. (D) EOPs for T7 knockouts with the Ec86 retron host. Plot was generated the same as B. (E) Proposed model of defense and counter-defense for Ec86 retron. (F) Growth curves for expression of g5.7 in cells containing no exogenous defense or the RADAR2 system. 1 x 10⁷ cells were either repressed with 0.2% glucose (uninduced) or induced with 0.1% L-arabinose and grown for ~14hrs. Central line represents the average of 3 replicates and the shaded flanking regions represent the standard deviation. (G) Growth curves for expression of g1.2 in cells containing no exogenous defense or the ApeA system. Experiment was performed and plot made the same way as F.

