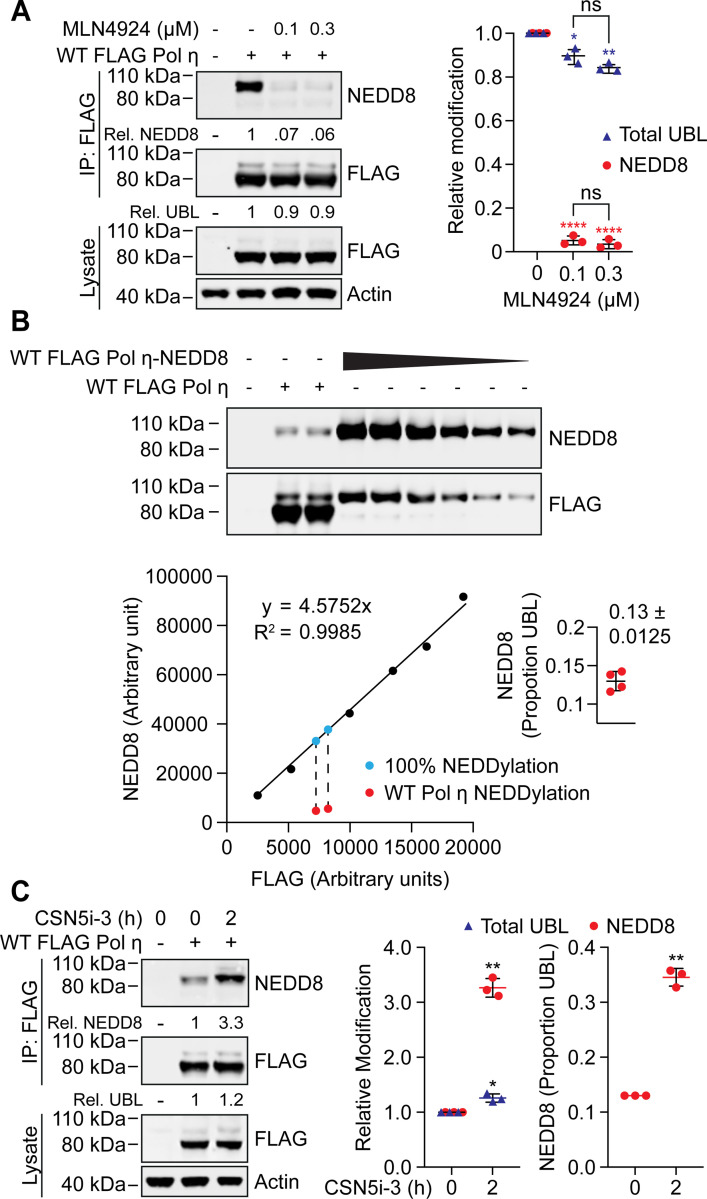
Figure 2: Pol η mono-NEDDylation is dynamically regulated in cells.
(A) 293T cells expressing WT FLAG Pol η were treated with 0.1 or 0.3 μM MLN4924, or mock treated with DMSO, for 16 hours. WT FLAG Pol η was immunoprecipitated from these cells, and samples immunoblotted as indicated. Relative mono-UBLylation was calculated based on the ratio of higher to lower FLAG Pol η bands. Mono-NEDDylation was calculated based on the ratio of NEDD8 to FLAG bands. The graph represents calculated values from three independent experiments. Error bars represent standard deviation. Unpaired t-tests were used to assess differences in Pol η modification. * = p < 0.5, ** = p < 0.1, **** = p <0.001, ns = not significant. (B) WT FLAG Pol η, or a WT FLAG Pol η-NEDD8 chimera, was immunoprecipitated from 293T cells. A dilution series of the chimeric protein, and technical replicates of WT FLAG Pol η, were immunoblotted and probed with FLAG and NEDD8 antibodies. The FLAG and NEDD8 bands of the chimera were quantified and are represented by the graph. A standard curve defined by a linear equation was determined for each repeat, where the multiplication factor represents the average ratio of FLAG to NEDD8 for each dilution. The NEDD8 and upper FLAG bands of the two WT FLAG Pol η lanes were also quantified, as represented in red. The ratio of NEDD8 to FLAG for the WT protein was compared to that of the chimeric protein, to calculate NEDDylation as a proportion of total UBLylation. The calculated values from four technical repeats are depicted in the inset graph. (C) 293T cells expressing WT FLAG Pol η were treated with 1 μM of the COP9 inhibitor CSN5i-3, or DMSO for 2 hours. FLAG Pol η was immunoprecpitated from these cells and the eluent and lysate immunoblotted as indicated. Relative mono-NEDDylation and relative mono-UBLylation was determined as per (A) and is represented in the left graph. The right graph represents changes in NEDDylation as a proportion of total UBLylation, assuming steady state levels of 0.13, as calculated in (B). Statistical analysis was performed as per (A).

