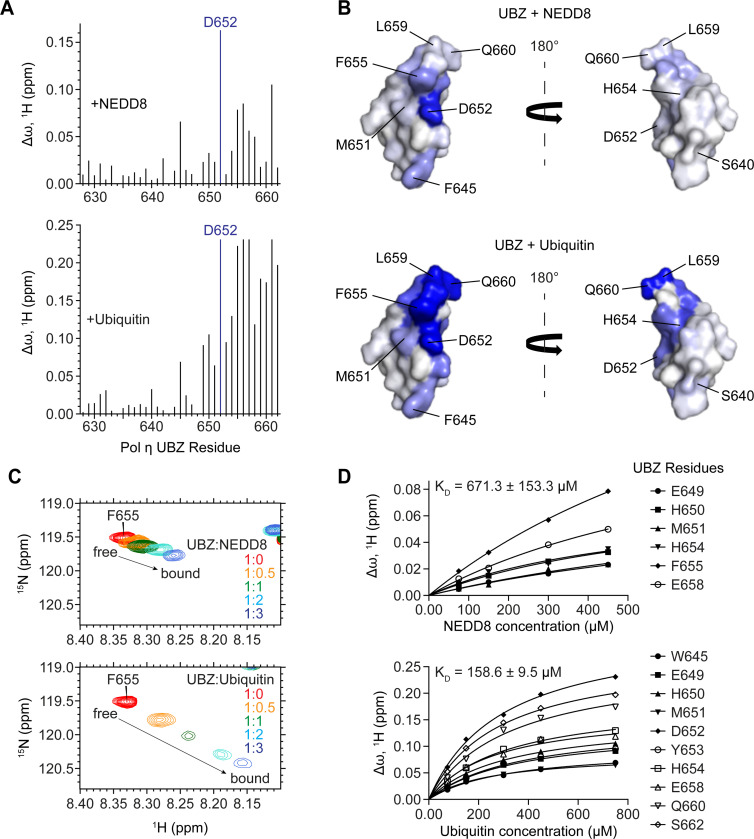
Figure 4: The UBZ domain of Pol η interacts with both ubiquitin and NEDD8 through a shared binding surface.
(A) A bar graph of per-residue chemical shift perturbations (CSPs) in 15N-TROSY-HSQC spectrum of 15N-labeled Pol η UBZ domain caused by the addition of unlabelled NEDD8 (top panel) and ubiquitin (bottom panel). Residues for which peaks disappeared due to broadening were assigned to the highest observed CSP value. (B) NEDD8 (top) and ubiquitin (bottom) binding sites mapped on the surface of the UBZ (PDB: 3WUP). The surface is color-coded according to the NMR CSPs (∆ω) from smallest (white) to largest (blue). The structures are shown in two orientations with a 180° rotation. (C) A representative region of the Pol η UBZ 15N-TROSY-HSQC spectra highlights the gradual transition of the peak corresponding to residue F655 from its free (red) to its bound conformation (blue) upon titration with either NEDD8 (top) or ubiquitin (bottom). (D) NMR titration plots used to estimate the KD of binding.

