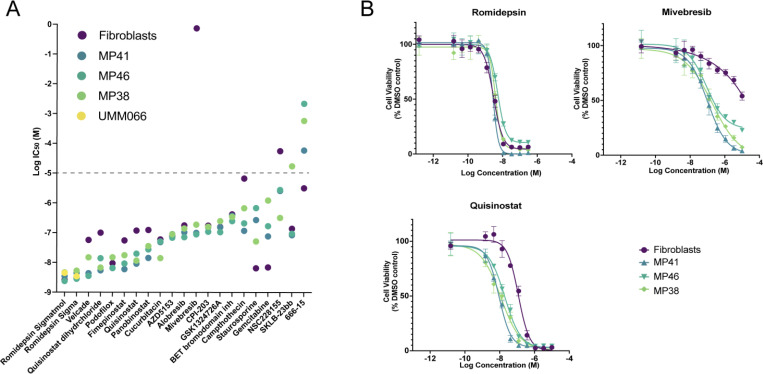
Figure 2. IC50 and dose-response curves of lead candidates in UM cell lines versus normal fibroblasts.
(A) LogIC50 values of the lead compounds in UM cell lines and normal fibroblasts. The dotted line indicates the highest concentration of drug used (10 μM); hence, for the values above, the IC50 is not determined accurately. n = 4 replicates for each concentration were tested. (B) Concentration-response curves of the top candidates (romidepsin, mivebresib, and quisinostat) for UM cell lines and WS1 fibroblasts. n = 4 per concentrations tested.

