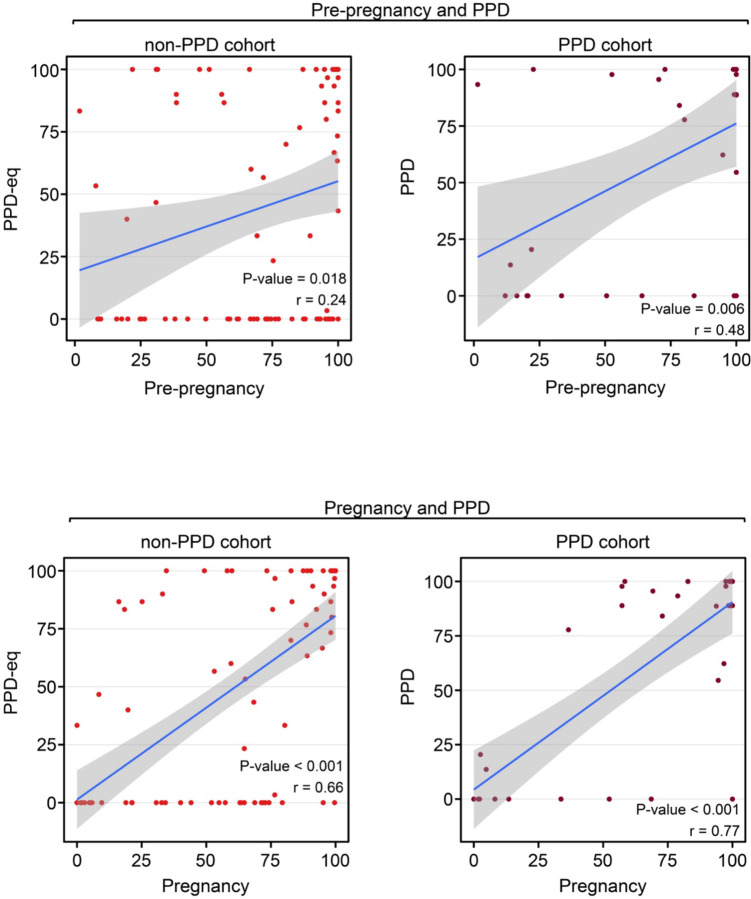
Figure 5: Women in the PPD and non-PPD cohorts displayed the same pattern of correlation between wear time during earlier and later pregnancy time periods.
*PPD-eq = PPD-equivalent
The Pearson correlation coefficient between the percentage of days women wore their Fitbit during pre-pregnancy and PPD (top) in addition to pregnancy and PPD (bottom). The blue line represents the line of best fit and gray shading shows the 95% confidence interval.

