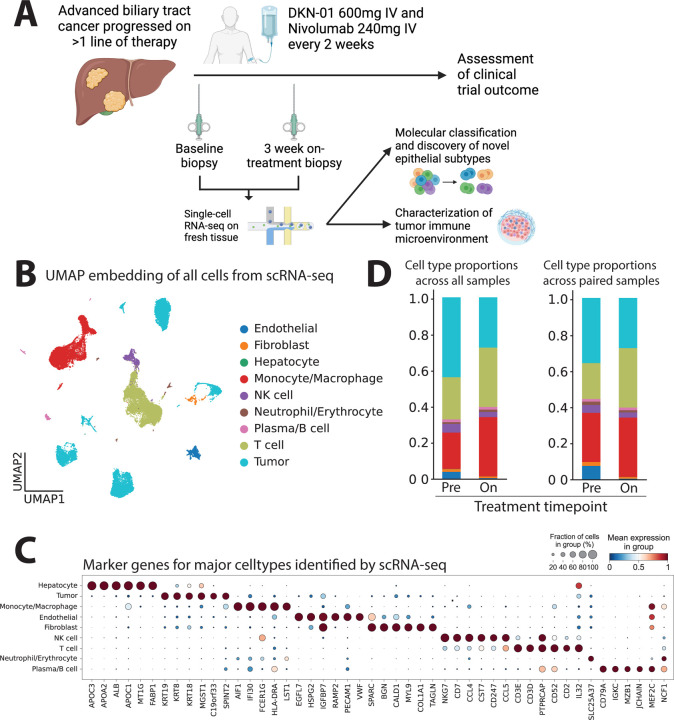
Figure 1.
Single-cell profiling of paired patient biopsies in a clinical trial of biliary tract cancers patients treated with DKN-01 and nivolumab. (A) Schematic of trial treatments, timing of biopsies and analysis performed in this study. (B) UMAP embedding of single-cell RNA-seq (scRNAseq) profiles of all cells obtained across biopsy samples labeled by major cell types. (C) Dot plot showing expression level and proportion of cells expressing marker genes for all major cell types from scRNAseq data. Differential expression analysis was performed using a Wilcoxon rank-sum test. (D) Cell type proportions of all major cell types in baseline and on-treatment samples analyzed using all samples (left; n=11) and only-paired samples (right, n=6).

