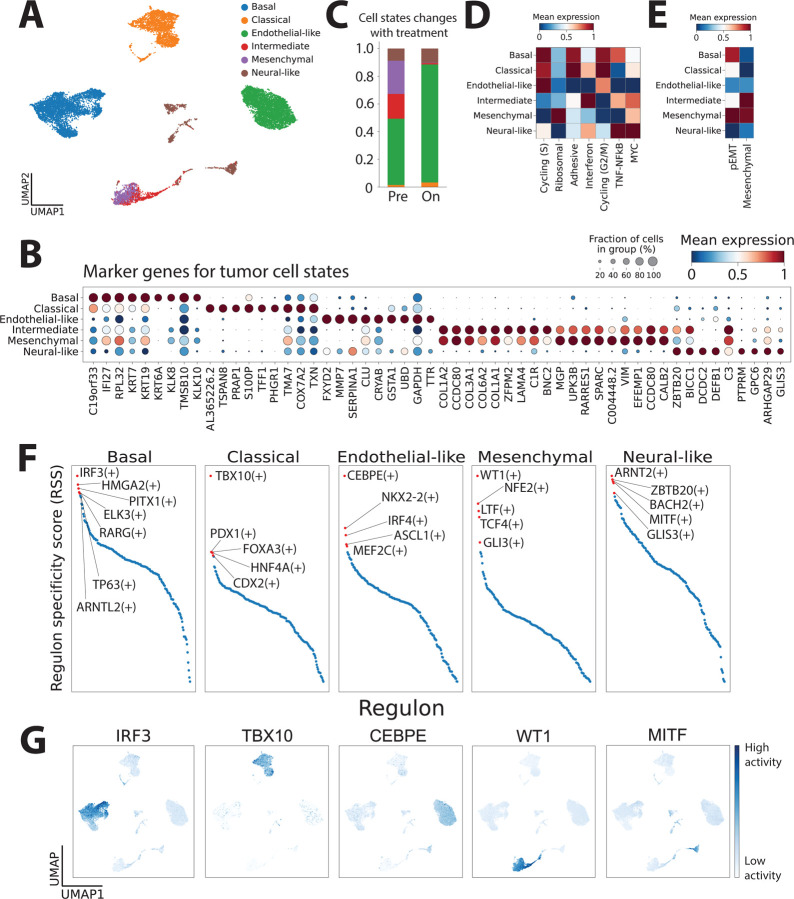
Figure 3.
Defining novel tumor cell states in biliary tract cancers. (A) UMAP embedding of all tumor cells profiled by scRNAseq labeled by tumor cell states. (B) Dot plot showing marker genes for each tumor cell state. Differential expression analysis was performed using a Wilcoxon rank-sum test. (C) Proportion of each tumor cell state relative to all tumor cells in pre- and on-treatment biopsies. (D)-(E) Pathway scoring of (D) known cell cycle and signaling and (E) EMT gene programs in tumor cells belonging to each cell state. (F) Prediction of regulons (using SCENIC+86) with highest specificity in each cell state. (G) UMAP embedding of all tumor cells showing activity of select tumor cell state-specific regulons.

