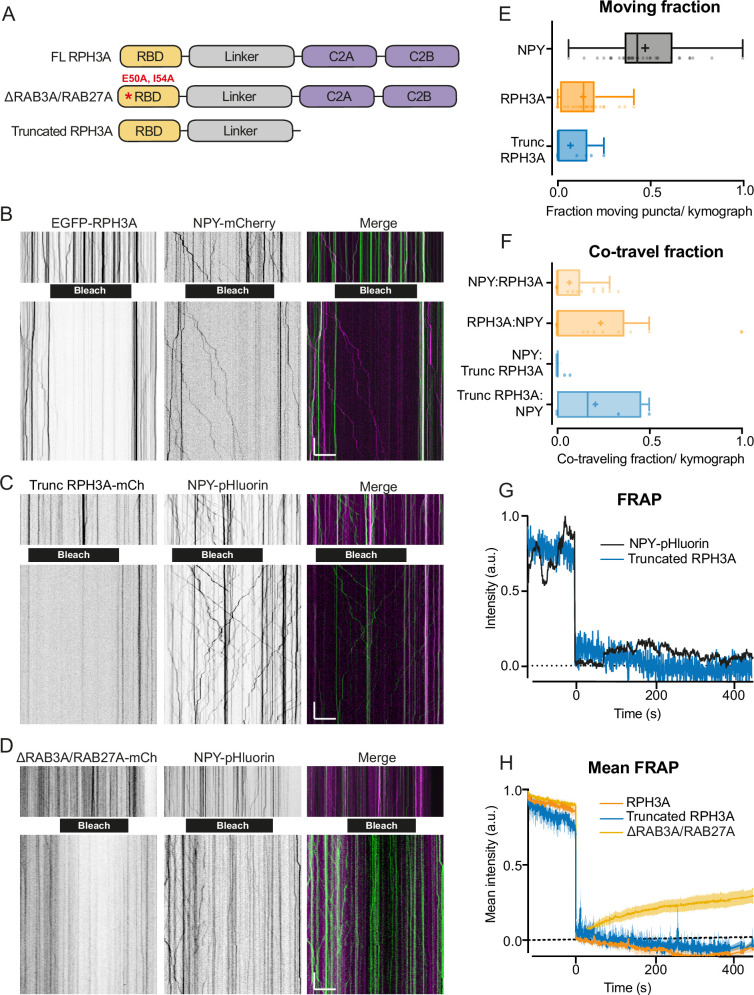
Figure 2. RPH3A does not travel with dense core vesicles (DCVs).
(A) Domain structures of full-length (FL) RPH3A and mutant RPH3A constructs lacking specific interactions: ∆RAB3A/RAB27A mutant RPH3A and truncated RPH3A that lacked its calcium and SNAP25-binding C2A and C2B domain. (B) Kymographs of EGFP-RPH3A and neuropeptide Y (NPY)-mCherry, (C) mCherry-trunc. RPH3A and NPY-pHluorin, and (D) mCherry-∆RAB3A/RAB27A mutant RPH3A and NPY-pHluorin before (upper) and after (lower) photobleaching (black bar). NPY-pHluorin showed more resistance to bleaching. This posed no issue as bleaching was merely applied to enhance the visualization of vesicles entering the bleached area and facilitate analysis. Merged images show mCherry (pseudo-colored magenta) and EGFP/pHluorin (green). Scale bar, 20 µm (x-axis) and 20 s (y-axis). (E) Moving fraction of NPY, FL RPH3A, and truncated RPH3A puncta per kymograph. N numbers of individual experiments: NPY: 1 (28); RPH3A: 1 (38); trunc. RPH3A: 1 (10). Dots represent a kymograph. (F) Fraction of co-travel of NPY puncta with either FL or truncated RPH3A puncta, and co-travel of FL or truncated RPH3A with NPY puncta. N numbers of individual experiments: NPY:RPH3A: 1 (28); RPH3A:NPY: 1 (21); NPY:trunc. RPH3A: 1 (10); trunc. RPH3A:NPY: 1 (4). (G) Fluorescent recovery of the traces shown in C after photobleaching truncated RPH3A or NPY-pHluorin, normalized from min to max. (H) Mean fluorescent recovery traces from multiple kymographs after photobleaching FL, truncated, or ∆RAB3A/RAB27A RPH3A. Lines±shading represents mean ± SEM. Boxplots represent median (line), mean (+), and Tukey range (whiskers).

