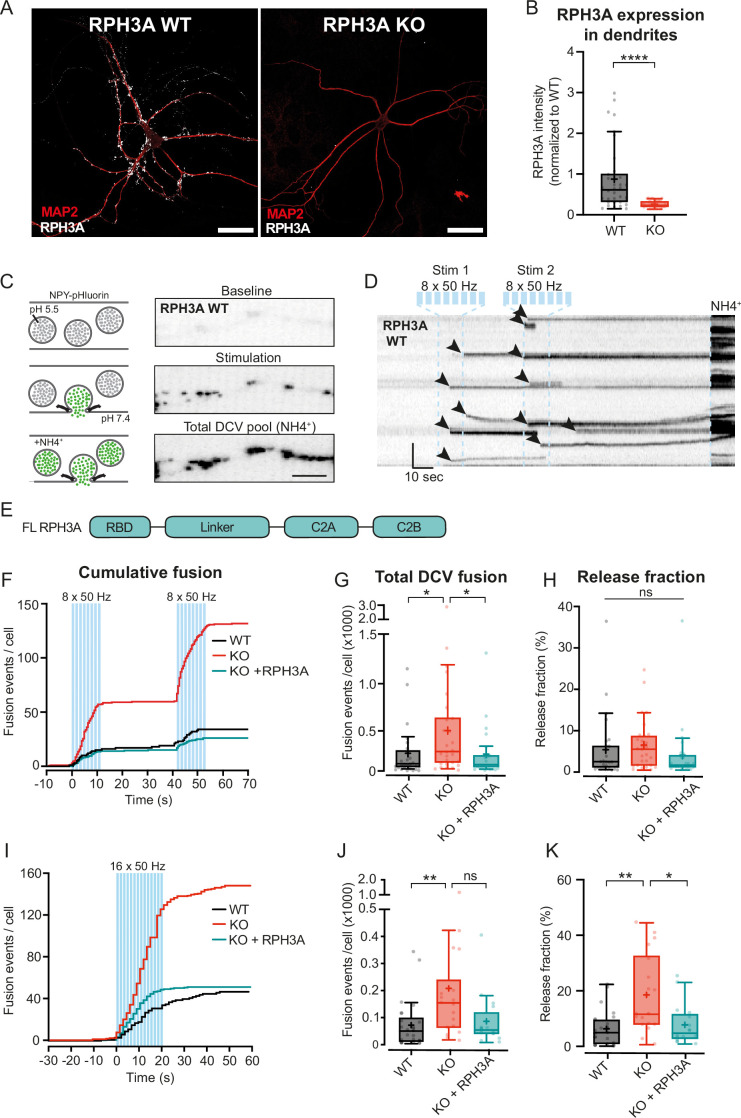
Figure 3. RPH3A deficiency increases dense core vesicle (DCV) exocytosis.
(A) Typical example of RPH3A wildtype (WT) and knockout (KO) neurons immunostained for MAP2 (red) and RPH3A (white). Scale bar, 50 µm. (B) RPH3A expression in dendrites of WT and KO neurons normalized to WT per independent experiment. N numbers of individual experiments and single neuron observations in brackets: WT: 4 (34); KO: 4 (33). (C) Schematic representation (left) and imaging example of a WT neurite stretch (right) infected with neuropeptide Y (NPY)-pHluorin as optical DCV fusion reporter. NPY-pHluorin is quenched in the acidic DCV lumen before fusion (baseline) but dequenches upon fusion (stimulation). NH4+ perfusion dequenches all NPY-pHluorin labeled DCVs (remaining DCV pool). Scale bar, 5 µm. (D) Kymograph of a WT neurite stretch with the stimulation paradigm used to elicit DCV fusion (two bursts of 8×50 action potential (AP) trains at 50 Hz interspaced by 0.5 s between each train and 30 s between each burst, blue bars) and NH4 perfusion (NH4+) used to dequench all NPY-pHluorin labeled vesicles. Arrowheads indicate fusion events. Scale bar, 10 s. (E) Domain structure of full-length (FL) RPH3A construct. (F) Cumulative median histogram of fusion events over time in WT (black), RPH3A KO (red), and KO neurons infected with FL RPH3A (cyan). Blue bars indicate the stimulation paradigm (two bursts of 8×50 AP bursts at 50 Hz). (G) Total number of DCV fusion events per condition (two bursts of 8×50 AP bursts at 50 Hz). (H) Released fraction defined as the number of fusion events normalized to the remaining pool of DCVs. N numbers of individual experiments and single neuron observations in brackets: WT: 5 (51); KO: 5 (43); KO+RPH3A: 5 (39). (I) Cumulative median histogram of events over time in WT (black), RPH3A KO (red), and KO neurons infected with FL RPH3A (cyan). Blue bars indicate the stimulation paradigm (16×50 AP bursts at 50 Hz). (J) Total number of DCV fusion events per condition (16×50 AP bursts at 50 Hz). (K) Release fraction per cell. N numbers of individual experiments and single neuron observations in brackets: WT: 4 (25); KO: 4 (18); KO+RPH3A: 4 (16). Boxplots represent the median (line), mean (+), and Tukey range (whiskers). Each dot represents an individual neuron. Line graphs represent the median. Mann-Whitney U test and or Kruskal-Wallis H test with Dunn’s correction: *p<0.05, **p<0.01, ****p<0.0001. ns = non-significant, p>0.05.


