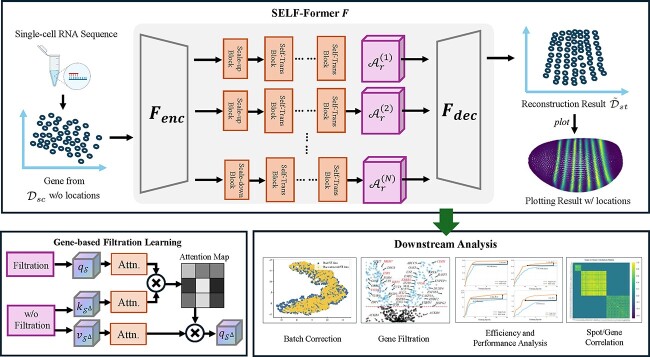
Figure 1.
The flowchart of proposed SELF-Former  . We take a random gene from the drosophila as an example: firstly, high-throughput expression data for the gene is extracted from single-cell resolution, as shown in the left image which lacks spatial information. Secondly, the scRNA-seq data is encoded from
  , primarily implemented as a self-attention transformer block. The bottom left corner illustrates an overview of gene-wise filtration learning. Next, features are aggregated along multi-scale self-attention blocks to obtain spatially resolved predictions of ST data. The aggregated representations are then processed through the decoder
  . The decoder reconstructs the ST data from these multi-scale features. The final output is the reconstructed ST data, which includes spatial locations for each gene expression, allowing for spatial plotting and further downstream analysis.

