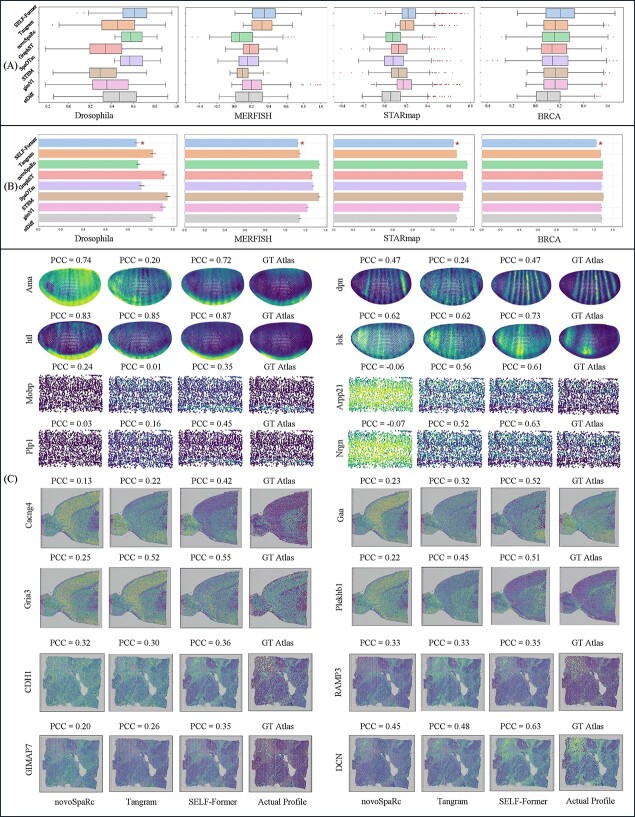
Figure 4.
Quantitative and qualitative results of spatial reconstruction. (A) and (B) show the PCC box plots and RMSE bar charts on four datasets, respectively, for SELF-Former and seven comparison methods. (C) presents visualizations of genes with strong spatial localization in the Drosophila, STARmap, MBA, and BRCA datasets. We display images from SELF-Former, novoSpaRc, Tangram, and Actual Profile, with corresponding PCC values listed above each gene and gene names on the left side of each row.

