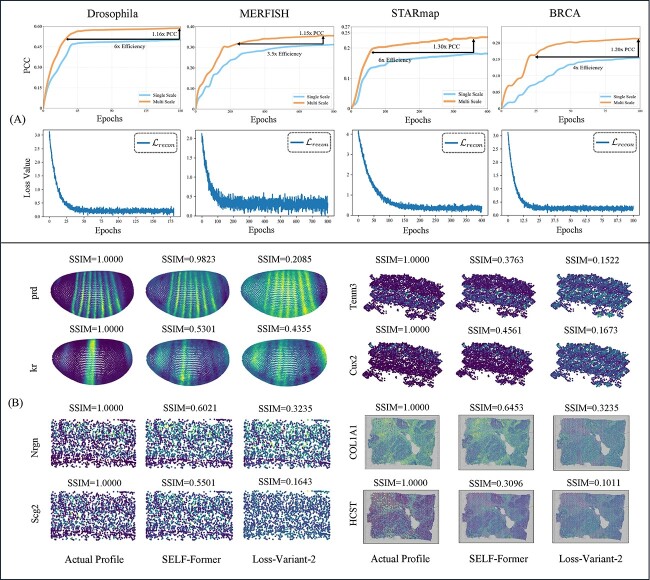
Figure 5.
Network structure efficiency analysis curves and visualization of spatial position correlation constraints. (A) shows two sets of curves. The first set compares the model performance and efficiency improvements for multi-scale and single-scale structures, with the vertical axis representing the corresponding PCC values and the horizontal axis representing the number of training epochs. The second set displays the reconstruction loss  curves, illustrating the decrease in loss values over training epochs. (B) presents visual comparison images with actual profile, SELF-Former and w/o loss
  .
.

