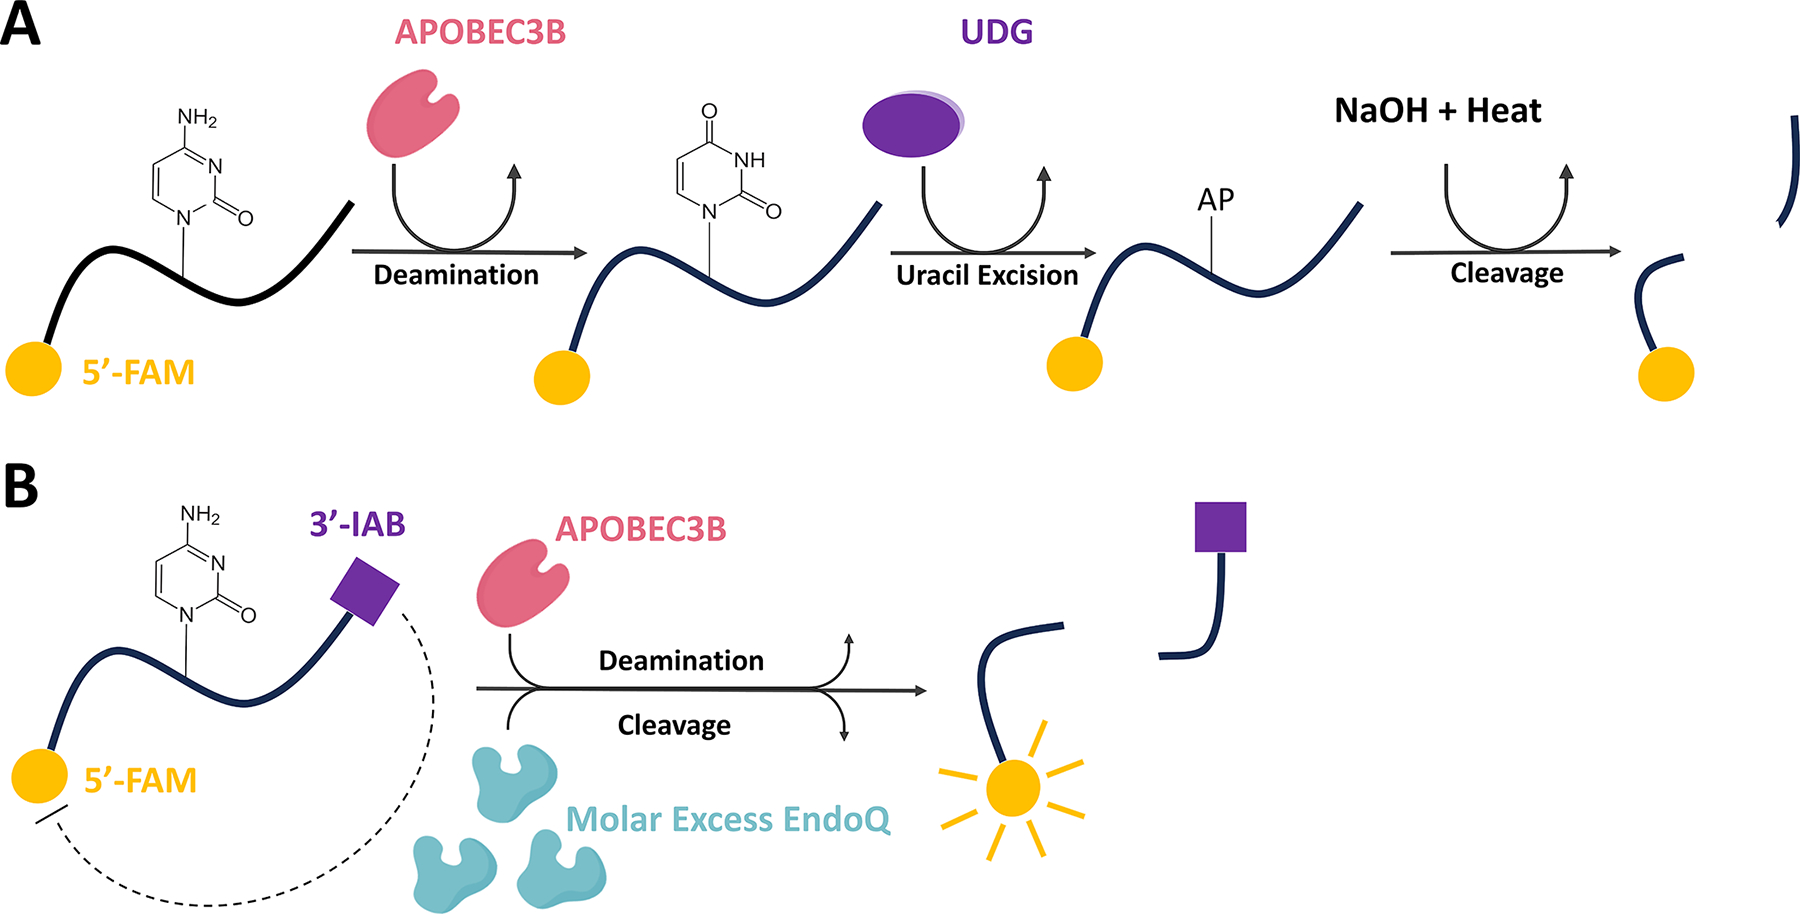
Fig. 1. UDG deamination assay versus the RADD assay.

(A) Schematic representing the molecular process involved in traditional UDG-based deamination assays. (B) Schematic of the molecular process which results in real-time fluorescence reporting of APOBEC deamination in a single step through the RADD assay. FAM represents a 5′ 6-carboxyfluorescein fluorophore while IAB represents a 3′ Iowa Black® FQ quencher.
Figure adapted from Belica, C., Carpenter, M. A., Chen, Y., Moeller, N., Harris, R. S., & Aihara, H. (2024). A real-time biochemical assay for quantitative analyses of APOBEC-catalyzed DNA deamination. Journal of Biological Chemistry.
