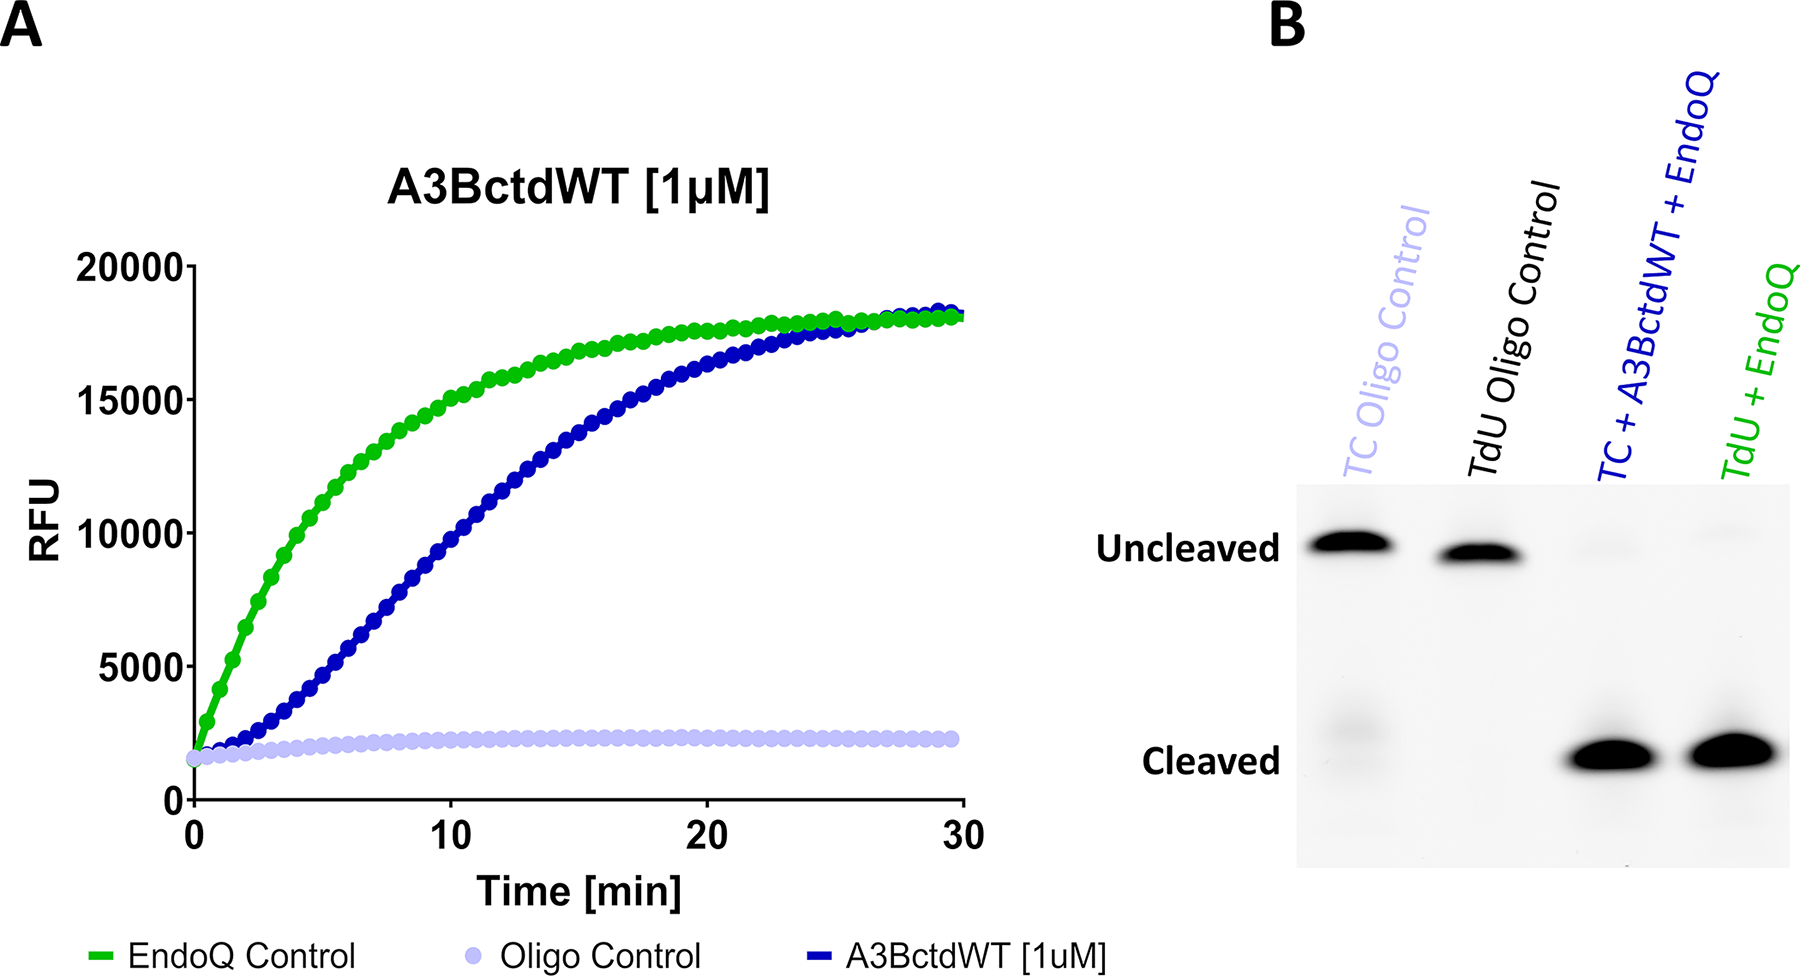
Fig. 2. Fluorescence and gel-based readout of the RADD assay.

(A) Fluorescence readout of a RADD assay monitoring the deamination activity of 1 μM A3BctdWT. The A3BctdWT reaction (dark blue) contained 1 μM TC reporter and 2 μM EndoQ. The EndoQ control reaction (green) contained A3BctdWT protein storage buffer, 2 μM EndoQ, and 1 μM TdU reporter. The negative control (light blue) contained 2 μM EndoQ, A3BctdWT protein storage buffer, and 1 μM TC reporter. (B) Gel readout of the reactions shown in A. Both the A3BctdWT and EndoQ control reactions show complete substrate processing within 30 min.
Figure adapted from Belica, C., Carpenter, M. A., Chen, Y., Moeller, N., Harris, R. S., & Aihara, H. (2024). A real-time biochemical assay for quantitative analyses of APOBEC-catalyzed DNA deamination. Journal of Biological Chemistry.
