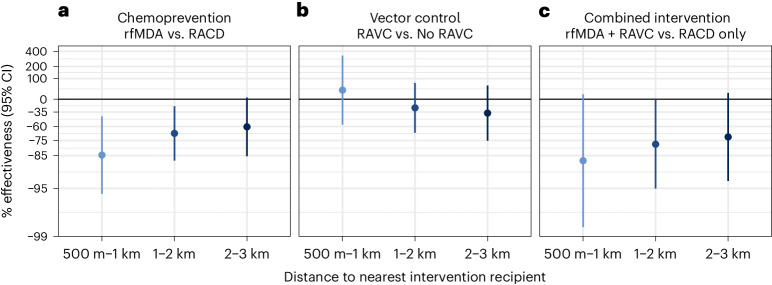
Fig. 3. Spillover effects of reactive, focal malaria interventions on prevalence by distance to nearest intervention recipient.
Spillover-effects analysis includes individuals with no intervention recipients within 500 m and any intervention recipients within the different distance radii. Data are presented as percentage effectiveness = (1 – RR) × 100%, where RR is the prevalence ratio between study arms. Vertical bars indicate 95% confidence intervals. a, Effects of the chemoprevention intervention (rfMDA versus RACD; n individuals 1 km, 245; 2 km, 435; 3 km, 367). b, Effects of the vector-control intervention (RAVC versus no RAVC; n individuals 1 km, 245; 2 km, 435; 3 km = 367). c, Effects of the combined intervention (rfMDA and RAVC versus RACD only; n individuals 1 km, 98; 2 km, 261; 3 km, 242). Effects on prevalence were estimated with TMLE using individual-level data; standard errors were adjusted for clustering at the enumeration-area level. Models were adjusted for covariates that were screened separately for each model using a likelihood ratio test. Models were unadjusted within strata of the intervention and outcome because there were fewer than 30 observations.

