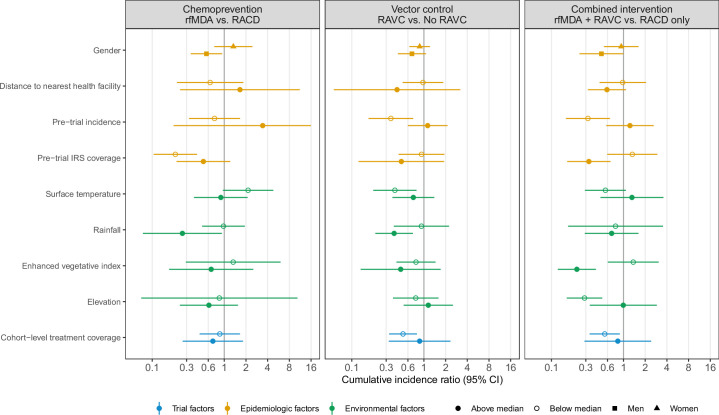
Extended Data Fig. 2. Spillover effect estimates on cumulative incidence within subgroups.
Data are presented as cumulative incidence ratios between study arms with horizontal bars to indicate 95% confidence intervals not accounting for potential outcome correlation. The chemoprevention analyses compared rfMDA vs. RACD; the vector control analyses compared RAVC vs. no RAVC; the combined intervention analyses compared rfMDA + RAVC vs. RACD only. Cumulative incidence ratios were estimated with hierarchical TMLE. All outcome models were fit with cohort-level data except for models of spillover effects of the combined intervention. Models were adjusted for covariates that were screened separately for each model using a likelihood ratio test. Models for the combined intervention were unadjusted because there were fewer than 30 observations within strata of the intervention and outcome. The chemoprevention analysis includes the period from 0–35 days following index case detection for direct effects and 21–56 days for spillover effects. The vector control analysis includes the period from 0–6 months following index case detection for direct effects and 17 days to 6 months for spillover effects. Spillover effect includes intervention non-recipients up to 1 km from an index case. Analyses of the chemoprevention and vector control interventions included N = 72,830 individuals and N = 310 cohorts; analyses of the combined intervention included N = 38,048 individuals and N = 143 cohorts. For the chemoprevention intervention, confidence interval upper bounds were truncated at 16 for pre-trial incidence above the median (observed value: 46) and elevation below the median (observed value: 23).

