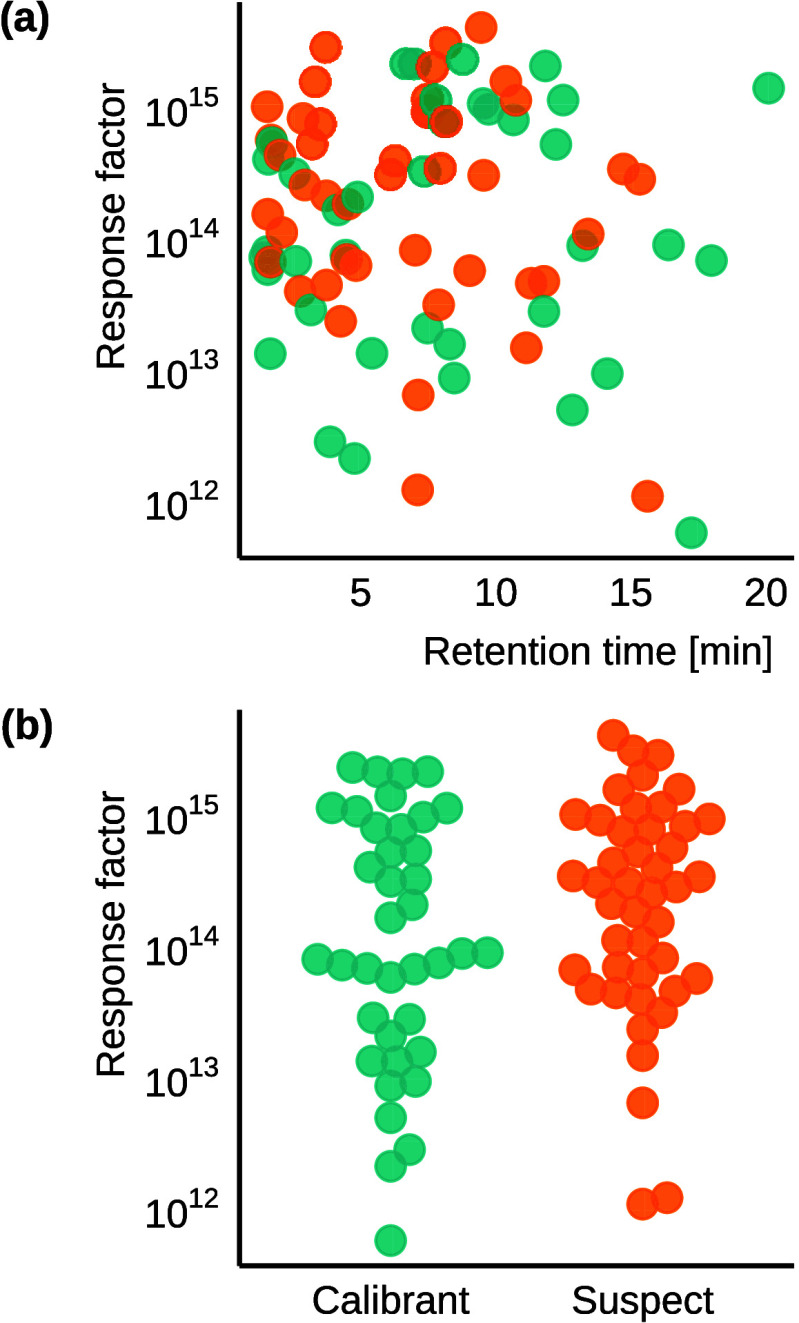
Figure 1.
Distribution of the selected compounds spiked to the water samples: (a) range of retention times and the response factors of the compounds in a 25 min gradient (see SI 2 - DS_QDF for analysis details), and (b) distribution of the response factors of calibration and suspect compounds.

