FIGURE 2.

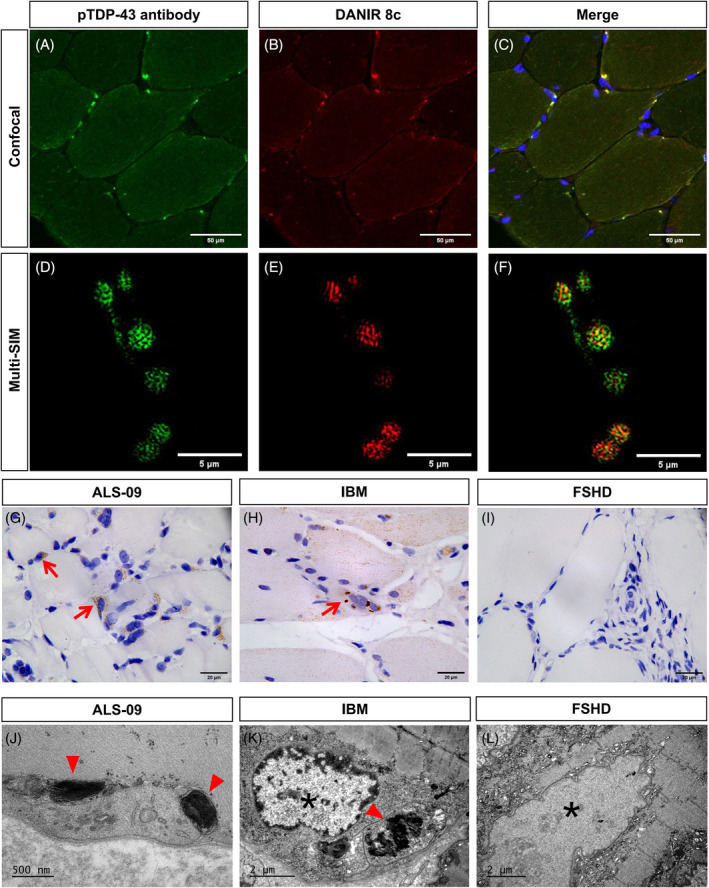
Fluorescence staining of TDP‐43 phosphorylation and its conformation by super‐resolution microscopy, immunohistochemical assay, and electron microscopy. (A–C) Immunofluorescence showed significant co‐localization of pTDP‐43 antibody and DANIR 8c probe, labeling aberrantly aggregated pTDP‐43 protein using confocal microscopy. (D–F) Immunofluorescence of pTDP‐43 antibody and DANIR 8c probe using super‐resolution microscopy (Multi‐SIM). (G–I) Immunohistochemical assay showed pTDP‐43 aggregates in muscle samples from ALS and IBM patients, while not in FSHD. (J–L) Electron microscopy showed phathological aggregations in muscle samples from ALS and IBM patients, while not in FSHD. The aggregates were mainly localized in cytoplasm and perinuclear regions of myofibers (red triangle). *Indicated the nuclei of myofiber.
