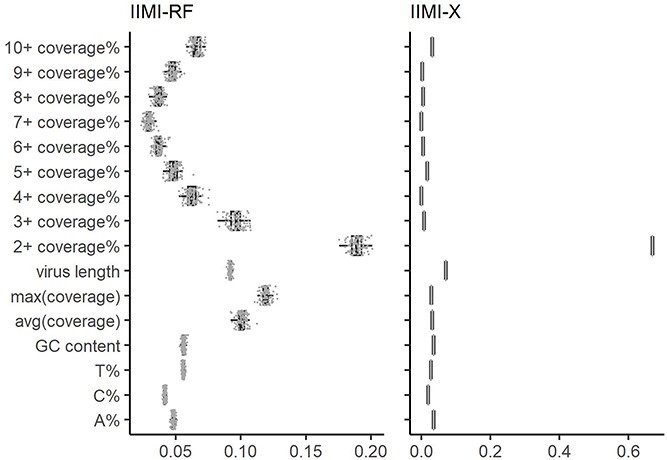
Figure 4.

Boxplots of variable importance using IIMI-RF and IIMI-X based on the in-house HTS dataset. Three models use different calculation metrics. IIMI-RF uses mean decrease in accuracy; IIMI-X uses the proportion of contribution to the model. The grey points are each replication of the feature’s importance.
