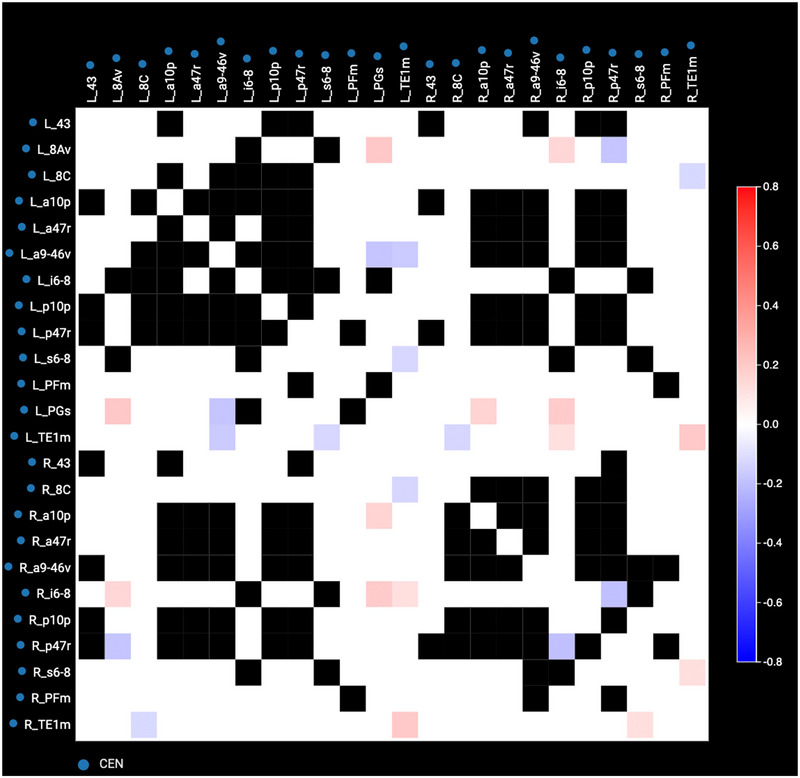
FIGURE 1.

Anomaly matrix of the CEN of Patient 1. Anomaly matrices display connectivity between sets of parcellations. White squares indicate connectivity within normal range, and black squares represent connectivity that is too variable to determine a normal range. Red represents hyperconnectivity, and blue represents hypoconnectivity. The degree of connectedness is indicated by the hue of the red or blue as described in the key on the right‐hand side of the matrix.
