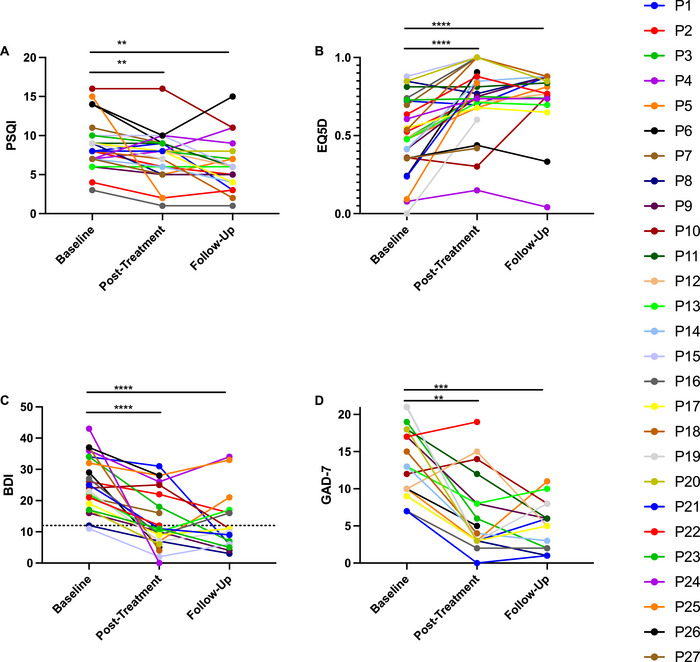
FIGURE 3.

Questionnaires on quality of life, sleep, and affective disorders. PSQI (Scale 0–21), EQ5D (Scale −0.594–1), BDI (Scale 0–63), and GAD‐7 (Scale 0–21) scores at baseline, after treatment, and during 1‐month follow‐up. (A) In the PSQI, there was improvement of sleep based on the PSQI after treatment (p = 0.0225, mixed‐effects analysis, Dunnett's multiple comparisons test, N = 27) and during follow‐up (p = 0.0005, mixed‐effects analysis, Dunnett's multiple comparisons test, N = 20) compared to baseline. (B) In the EQ5D, there was improvement after treatment (p < 0.0001, mixed‐effects analysis, Dunnett's multiple comparisons test, N = 27) and during follow‐up (p < 0.0001, mixed‐effects analysis, Dunnett's multiple comparisons test, N = 20) compared to baseline. (C) In the BDI, there was improvement after treatment (p < 0.0001, mixed‐effects analysis, Dunnett's multiple comparisons test, N = 23) and during follow‐up (p < 0.0001, mixed‐effects analysis, Dunnett's multiple comparisons test, N = 16) compared to baseline. Dotted line corresponds to the BDI remission score. (D) In the GAD‐7, there was improvement after treatment (p = 0.0002, mixed‐effects analysis, Dunnett's multiple comparisons test, N = 19) and during follow‐up (p < 0.0001, mixed‐effects analysis, Dunnett's multiple comparisons test, N = 15) compared to baseline. BDI, Beck's Depression Inventory; EQ5D, EuroQol; GAD‐7, General Anxiety Disorder‐7; PSQI, Pittsburgh Sleep Quality Index.
