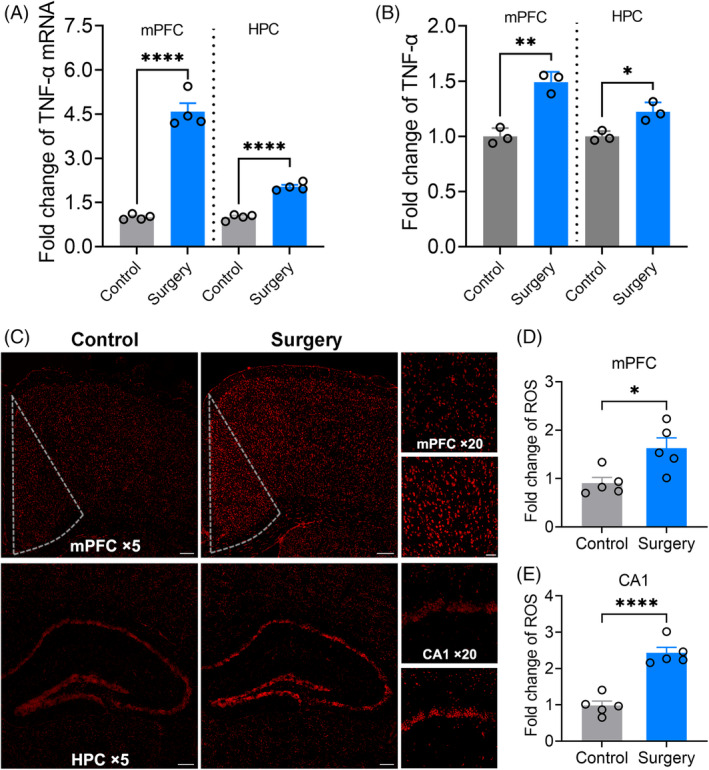
FIGURE 5.

Neuroinflammatory reaction and oxidative stress in dorsal hippocampus and medial prefrontal cortex (mPFC) were induced after surgery in a region dependent manner. (A) and (B) The levels of TNF‐α mRNA and protein in the mPFC and hippocampus. (C) Confocal images of ROS in mPFC and hippocampus. Scale bars: ×5: 200 μm; ×20: 50 μm. (D) The fold change of ROS level in the mPFC. (E) The fold change of ROS level in the CA1. Data are represented as mean ± SEM (n = 4–5) and analysed with Student t‐test. *p < 0.05, ***p < 0.001, ****p < 0.0001.
