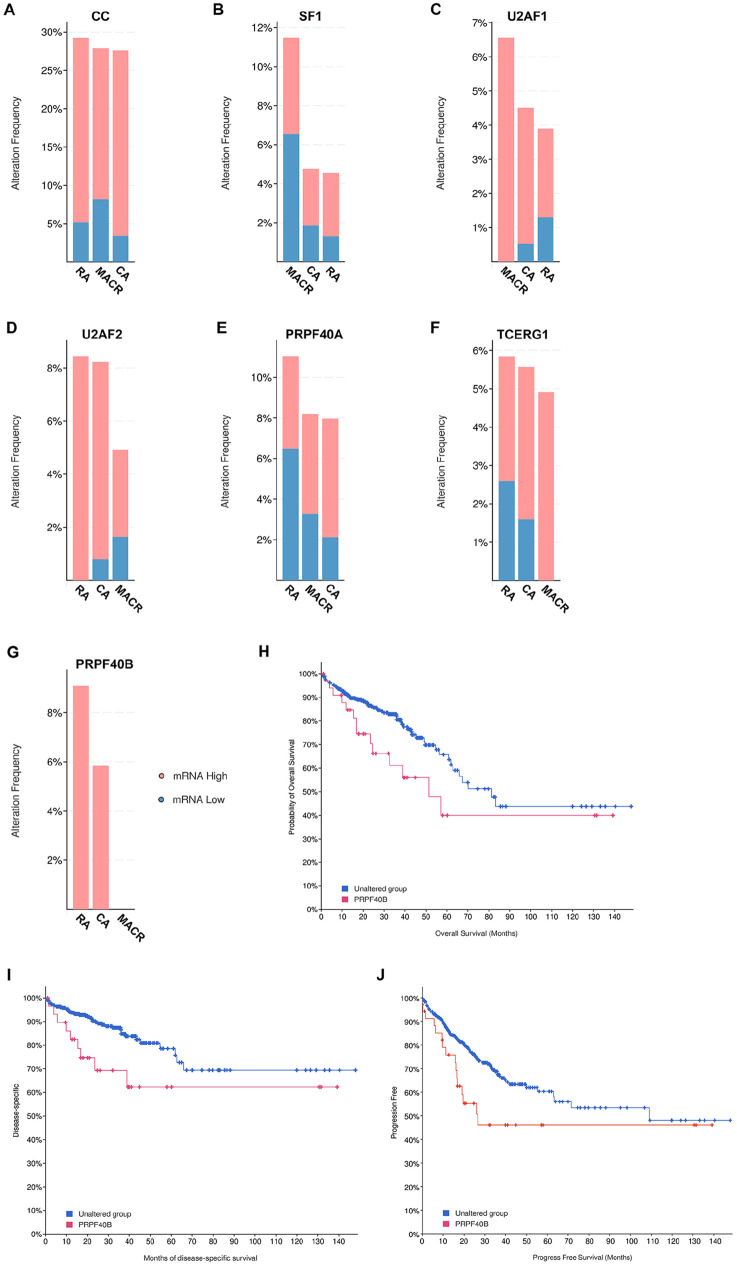
Figure 3.
Incidence of alterations in mRNA levels only from TCGA, PanCancer Atlas bowel cancer dataset (594 patients) of (A) all 6 CC genes (CC); (B) SF1; (C) U2AF1; (D) U2AF2; (E) PRPF40A; (F) TCERG1; and (G) PRPF40B. TCGA, PanCancer Atlas bowel cancer dataset was queried for the 6 CC factors and selected for mRNA expression only: mRNA expression z-scores relative to diploid samples (RNA Seq V2 RSEM). Graph of cancer types detailed. Pink represents mRNA high and blue represents mRNA low. Key: as in Figure 1B. (H) Overall survival, (I) disease-specific survival, and (J) progression-free survival of patients with high PRPF40B mRNA. Blue line represents unaltered group (patients without alterations in mRNA levels of any CC factor) and red line represents patients with high mRNA levels of PRP40B. Overall survival using 459 patients (q = 0.047), disease-specific survival, 445 patients (q = 0.047) and progression free survival, 459 patients (q = 0.047).

