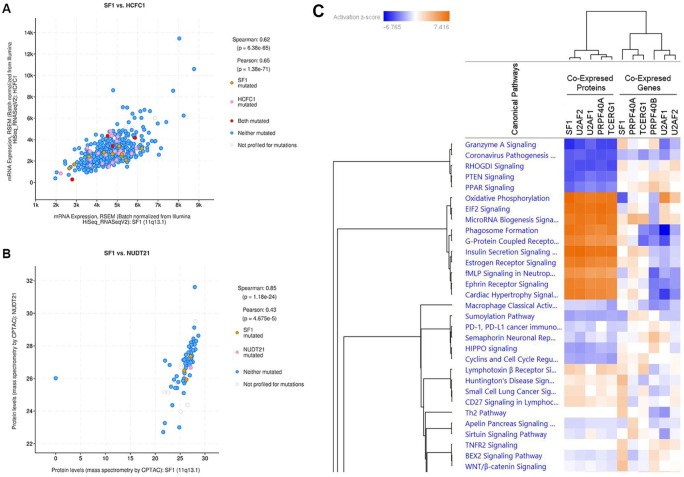
Figure 5.
Co-expression and Ingenuity Pathway Analysis (IPA). (A) mRNA co-expression of HCFC1 with SF1 (q-value = 1.27e-60) in bowel cancer (TCGA PanCancer Atlas). mRNA expression is derived from RSEM (Batch normalized from Illumina HiSeq_RNASeqV2). Data are from 592 samples. (B) Protein co-expression of NUDT21 with SF1 (q-value = 6.53e-21) in bowel cancer (TCGA PanCancer Atlas). Protein co-expression is derived from mass spectrometry by CPTAC. Data are from 84 samples. (C) Heat map derived from QIAGEN Ingenuity Pathway Analysis using co-expressed proteins and mRNA associated with each of the 6 CC factors in bowel cancers. Left 5 lanes are derived from gene lists of proteins co-expressed with SF1, U2AF2, U2AF1, PRPF40A, and TCERG1. Right 6 lanes are derived from mRNA gene lists co-expressed with SF1, PRPF40A, TCERG1, PRPF40B, U2AF1, and U2AF2.

