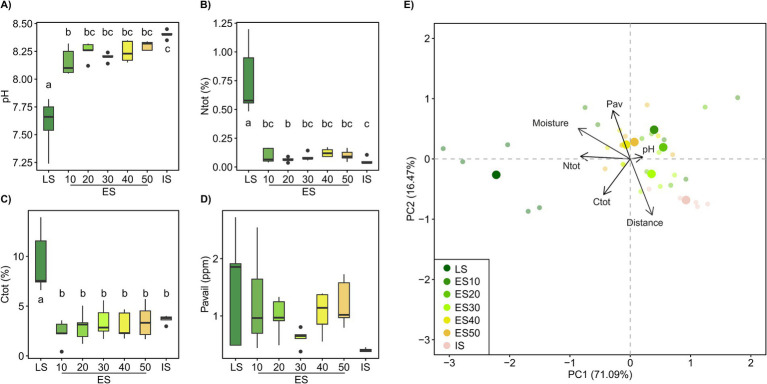
Figure 1.
Soil properties, pH, total N (Ntot), total C (Ctot), and available P (Pav), across a successional grassland sequence. In (A–D), treatments with different letters are significantly different (p < 0.05, ANOVA, Tukey’s test). (E) The principal component analysis (PCA) biplot shows clustering of samples based on their soil chemical properties, the “distance” vector represents the distance to the LS and was added to the ordination as a supplementary variable using envfit. LS, late successional plots; ES, early successional plots, numbers denote distance (in m) to the LS; IS, initial soil.

