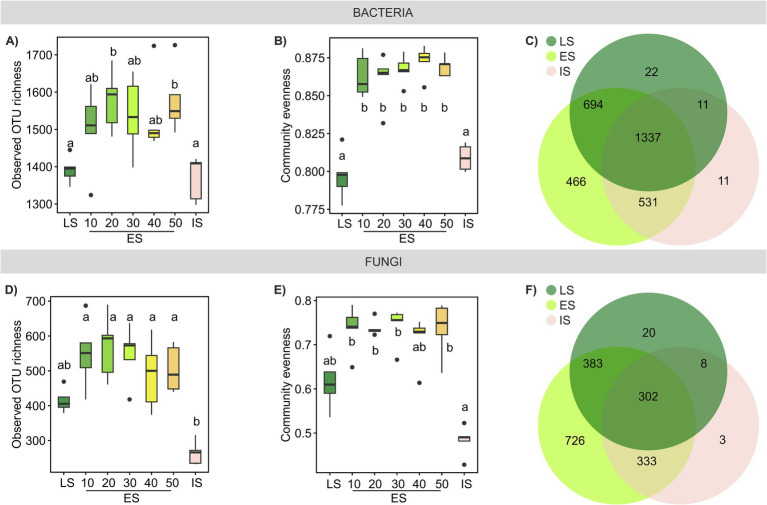
Figure 4.
Microbial richness and evenness across a successional grassland sequence. (A,D) Observed OTU richness and (B,E) community evenness of bacterial and fungal communities; treatments with different letters are significantly different (p < 0.05, ANOVA, Tukey’s test). (C,F) Venn diagrams illustrate the number of OTUs specific to each habitat or shared among them.

