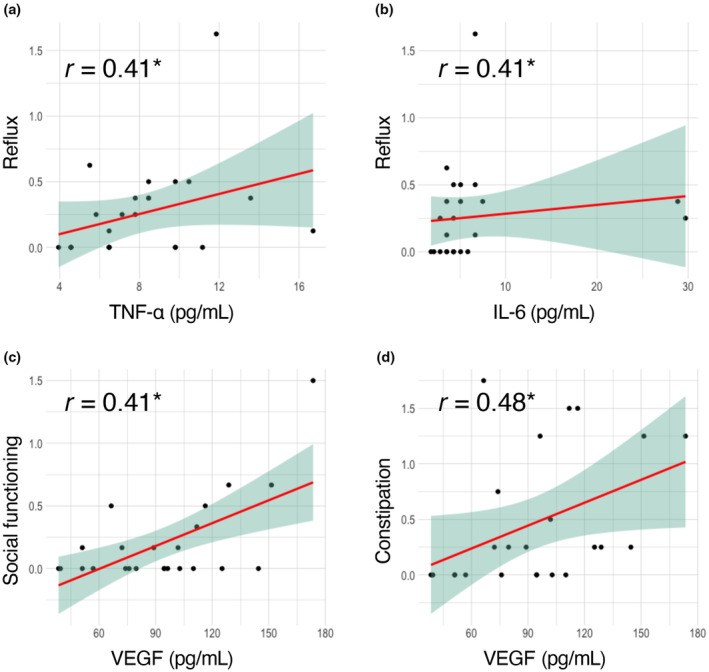
FIGURE 1.

Correlation between serum cytokine levels and Japanese University of California Los Angeles scleroderma clinical trial consortium gastrointestinal tract instrument 2.0 scores. Scatter plots of tumor necrosis factor‐alpha (TNF‐α) versus reflux subscale (a), interleukin‐6 (IL‐6) versus reflux subscale (b), vascular endothelial growth factor (VEGF) versus social functioning subscale (c), and VEGF versus constipation subscale (d). r: Spearman's rho. *P < 0.05. The red line and the green area represent the regression line and its 95% confidence interval, respectively.
