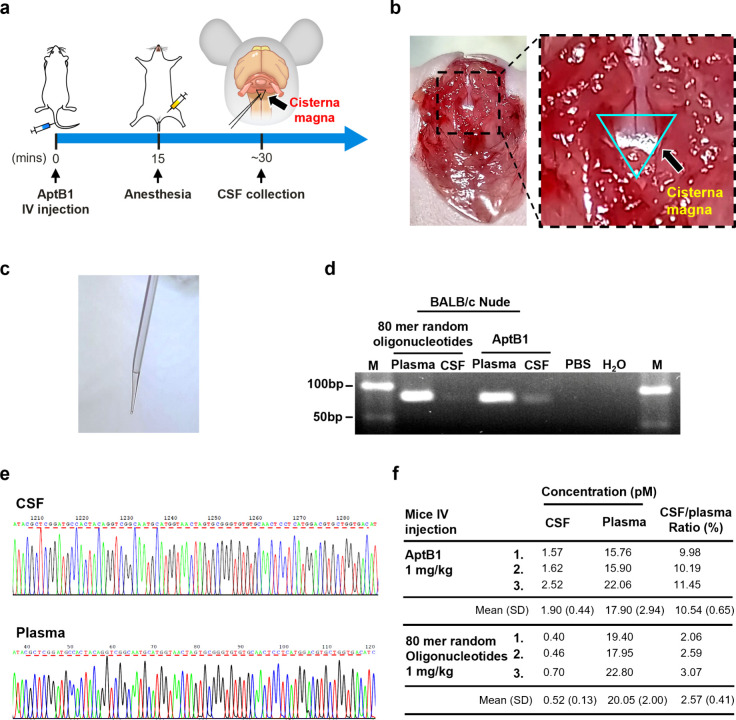
Figure 3.
Detection of AptB1 in the CSF. (a) The CSF was sampled directly from the cisterna magna 30 min after AptB1 injection through the tail vein. (b) Gross picture of mouse cisterna magna (blue triangle). (c) The CSF was sampled from the cisterna magna with a capillary. (d) The AptB1 was amplified from the CSF and the plasma. The PCR cycle number was 20. (e) Accuracy of the amplified AptB1 sequences was confirmed by Sanger sequencing. (f) Concentrations of the CSF and the plasma AptB1 were determined by qPCR. SD: standard deviation.

