. 2024 Oct 1;15(44):18476–18489. doi: 10.1039/d4sc04947k

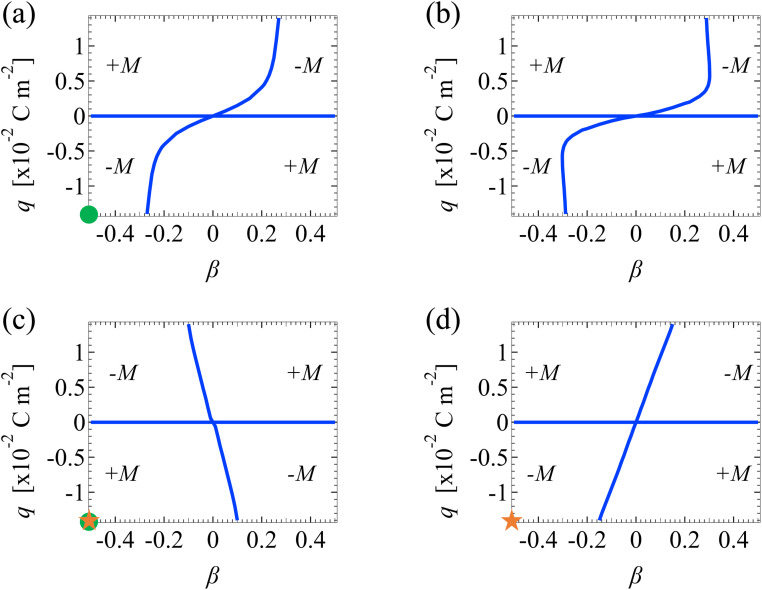
Fig. 7. Diffusioosmotic flow direction of monovalent electrolytes versus the channel surface charge density q and ion diffusivity ratio β. Ion–ion electrostatic correlations are accounted for (δc = κlc). (a): Bulk electrolyte molar concentration C = 10−3 M and slip length = 0. (b): C = 10−3 M and = 1. (c): C = 1 M and = 0. (d): C = 1 M and = 1. Domains with a positive (negative) mobility M denote that diffusioosmosis is from a region of low (high) to high (low) electrolyte concentration. Circle symbols in (a) and (c) correspond to the mobility at C = 10−3 M and C = 1 M along the line = 0 in Fig. 3(b). Star symbols in (c) and (d) correspond to the mobility with = 0 and = 1 at C = 1 M in Fig. 3(b).

Fig. 7