. 2024 Jun 24;41(10):1543–1578. doi: 10.1039/d4np00009a

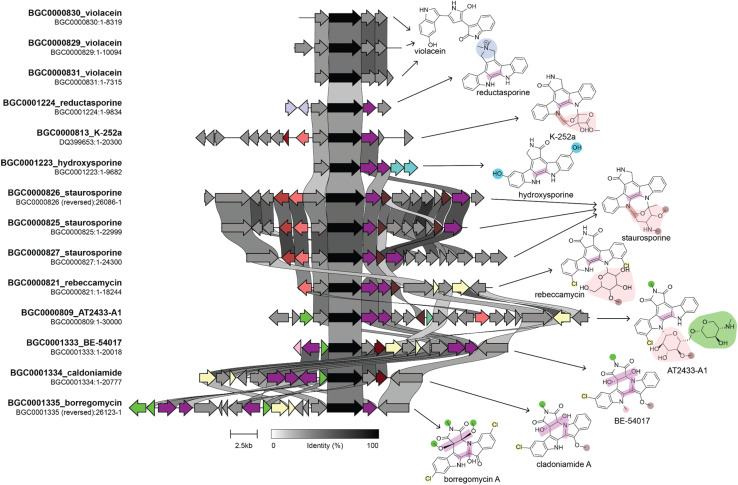
Fig. 8. Genome mining for tryptophan dimer NP analogs. This figure shows a comparison of BGCs and their corresponding products. The BGC image was created using clinker with BGCs retrieved from the MIBiG database. The genes in black are homologs of staD, the gene used as a handle for eDNA genome mining by the Brady lab. Connections between genes indicate percent sequence identity. We identified several genes that lead to structural divergence and colored them based on enzymatic activity in a manner consistent with the coloring of functional groups on the product structure. Homologous genes are given the same color even if they have divergent enzymatic activities. Note that not all structural differences in the product are due to gene gain or loss. For example staC and rebC, which are involved in the conversion of chromopyrrolic acid to the staurosporine and rebeccamycin aglycone, respectively, result in different oxidation states at the C-7 position, which suggests that differences in these enzymes' catalytic activity results in structural divergence. Information on the biosynthesis of these compounds used in the figure was obtained from ref. 268–270, and 277–279.

Fig. 8