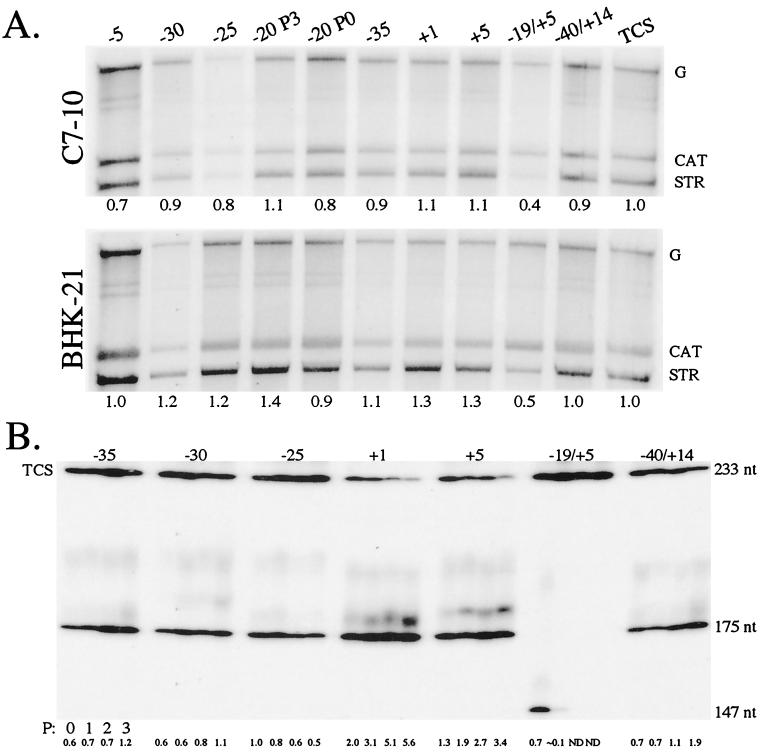
FIG. 5.
Promoters of P3 clones. (A) Promoter activity. C7-10 or BHK-21 cells were infected with the most frequently isolated virus from each P3 population (Table 3) and an isolate from the −20 library at P0 with promoter sequence of 3′AAGCU. Viral RNAs were radiolabeled in vivo with [32P]orthophosphate at 3 h (BHK-21) or 21.5 h (C7-10) p.i. and isolated at 5 or 24 h p.i., respectively. Total RNA was denatured and resolved on a 1% agarose gel. [32P]orthophosphate-radiolabeled RNA was examined via autoradiography and phosphorimager analyses. G denotes the genomic RNA of each clone; CAT denotes CAT mRNA transcribed by the −98/+14 CAT subgenomic mRNA promoter; and STR denotes STR mRNA transcribed by the STR promoter region of each virus. Relative promoter activity, listed below each lane, was determined by finding the ratio of STR to CAT mRNA for each sample and normalizing the values against that calculated for TCS. (B) Fitness of the viruses. The viruses were competed against TCS by transfecting approximately equal amounts of the respective in vitro transcripts into C7-10 cells. The resulting virus populations were passaged three more times. The promoter region of viruses in each mix is amplified by RT-PCR, labeled, and gel resolved as described in the legend to Fig. 2B. The relative abundance of each P3 virus relative to that of TCS is listed below each lane. The size of the PCR product from TCS is 233 bp, that from the P3 clones is 175 bp, and that from the −19/+5 virus is 147 bp.

