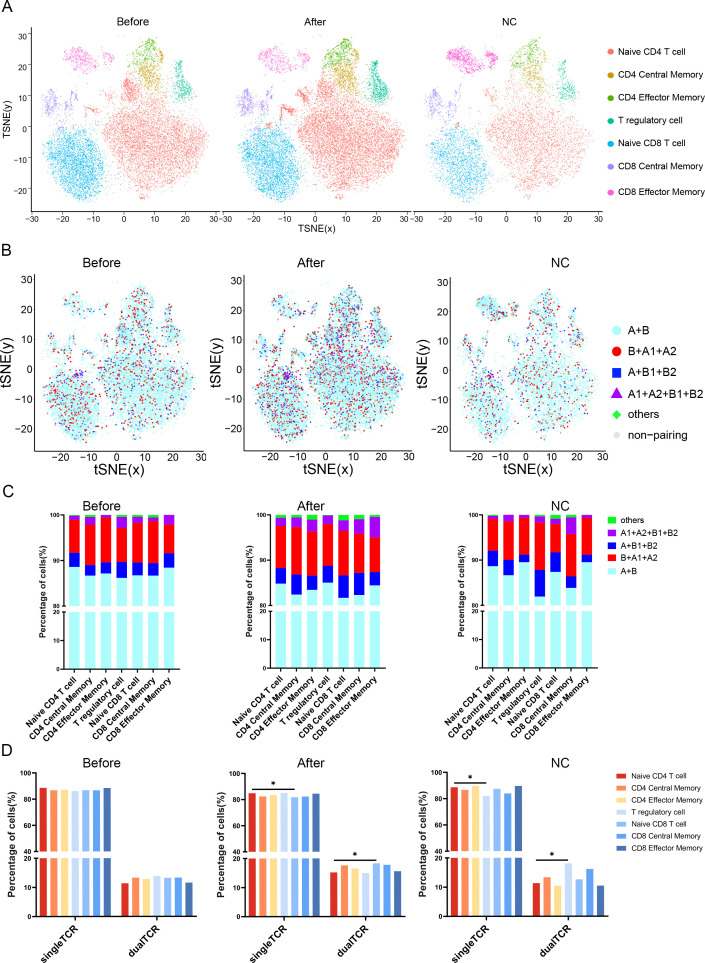
Figure 4.
Distribution and proportions of single and dual receptor T cells across different subsets. (A) The UMAP plot illustrates the distribution of 7 T cell subpopulations before VIG treatment, after IVIG treatment, and in the control group; (B) The figure depicts the distribution of 5 types of TCR T cells before and after IVIG treatment, as well as in the control group; (C) This figure demonstrates the proportions of 5 types of TCR T cells before IVIG treatment, after IVIG treatment, and in the control group; (D) Statistical analysis reveals the proportions of single and dual TCR T cells before VIG treatment, after IVIG treatment, and in the control group. *P<0.05.

