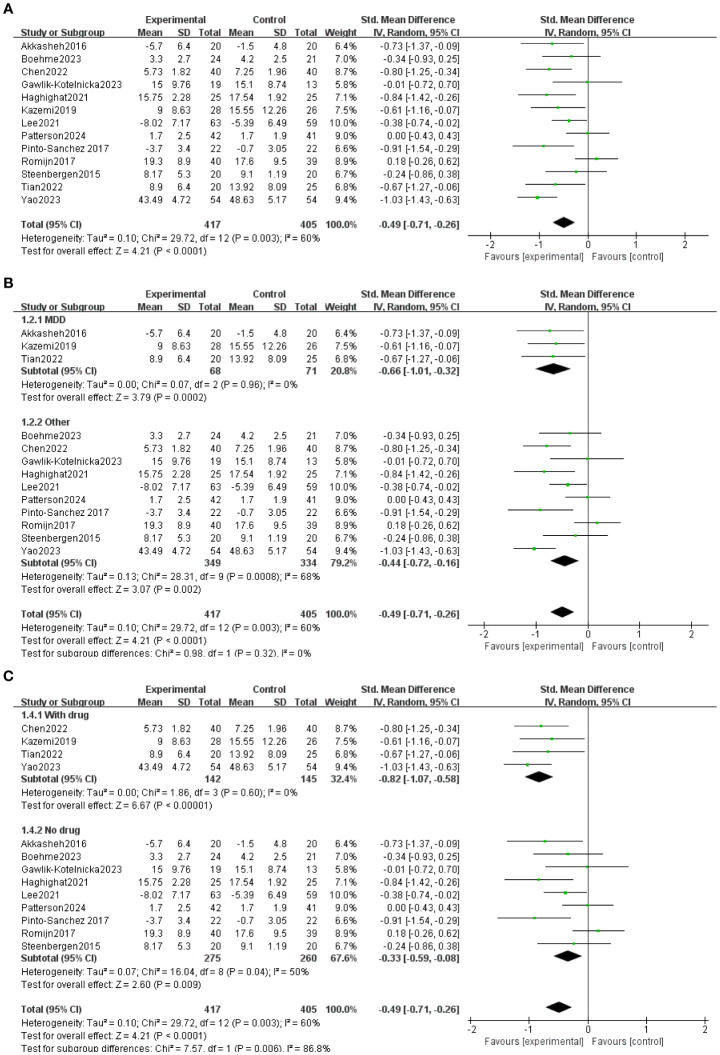
Figure 3.
(A) General forest map of bifidobacteria and their related agents for the treatment of depression. (B) Forest plot divided into two subgroups, “major depressive disorder” and “other”, according to the severity of depressive symptoms. (C) Forest plots divided into two subgroups: “taking drugs” and “not taking drugs” according to whether they took other drugs.

